PJT Partners Investment Banking Pitch Book
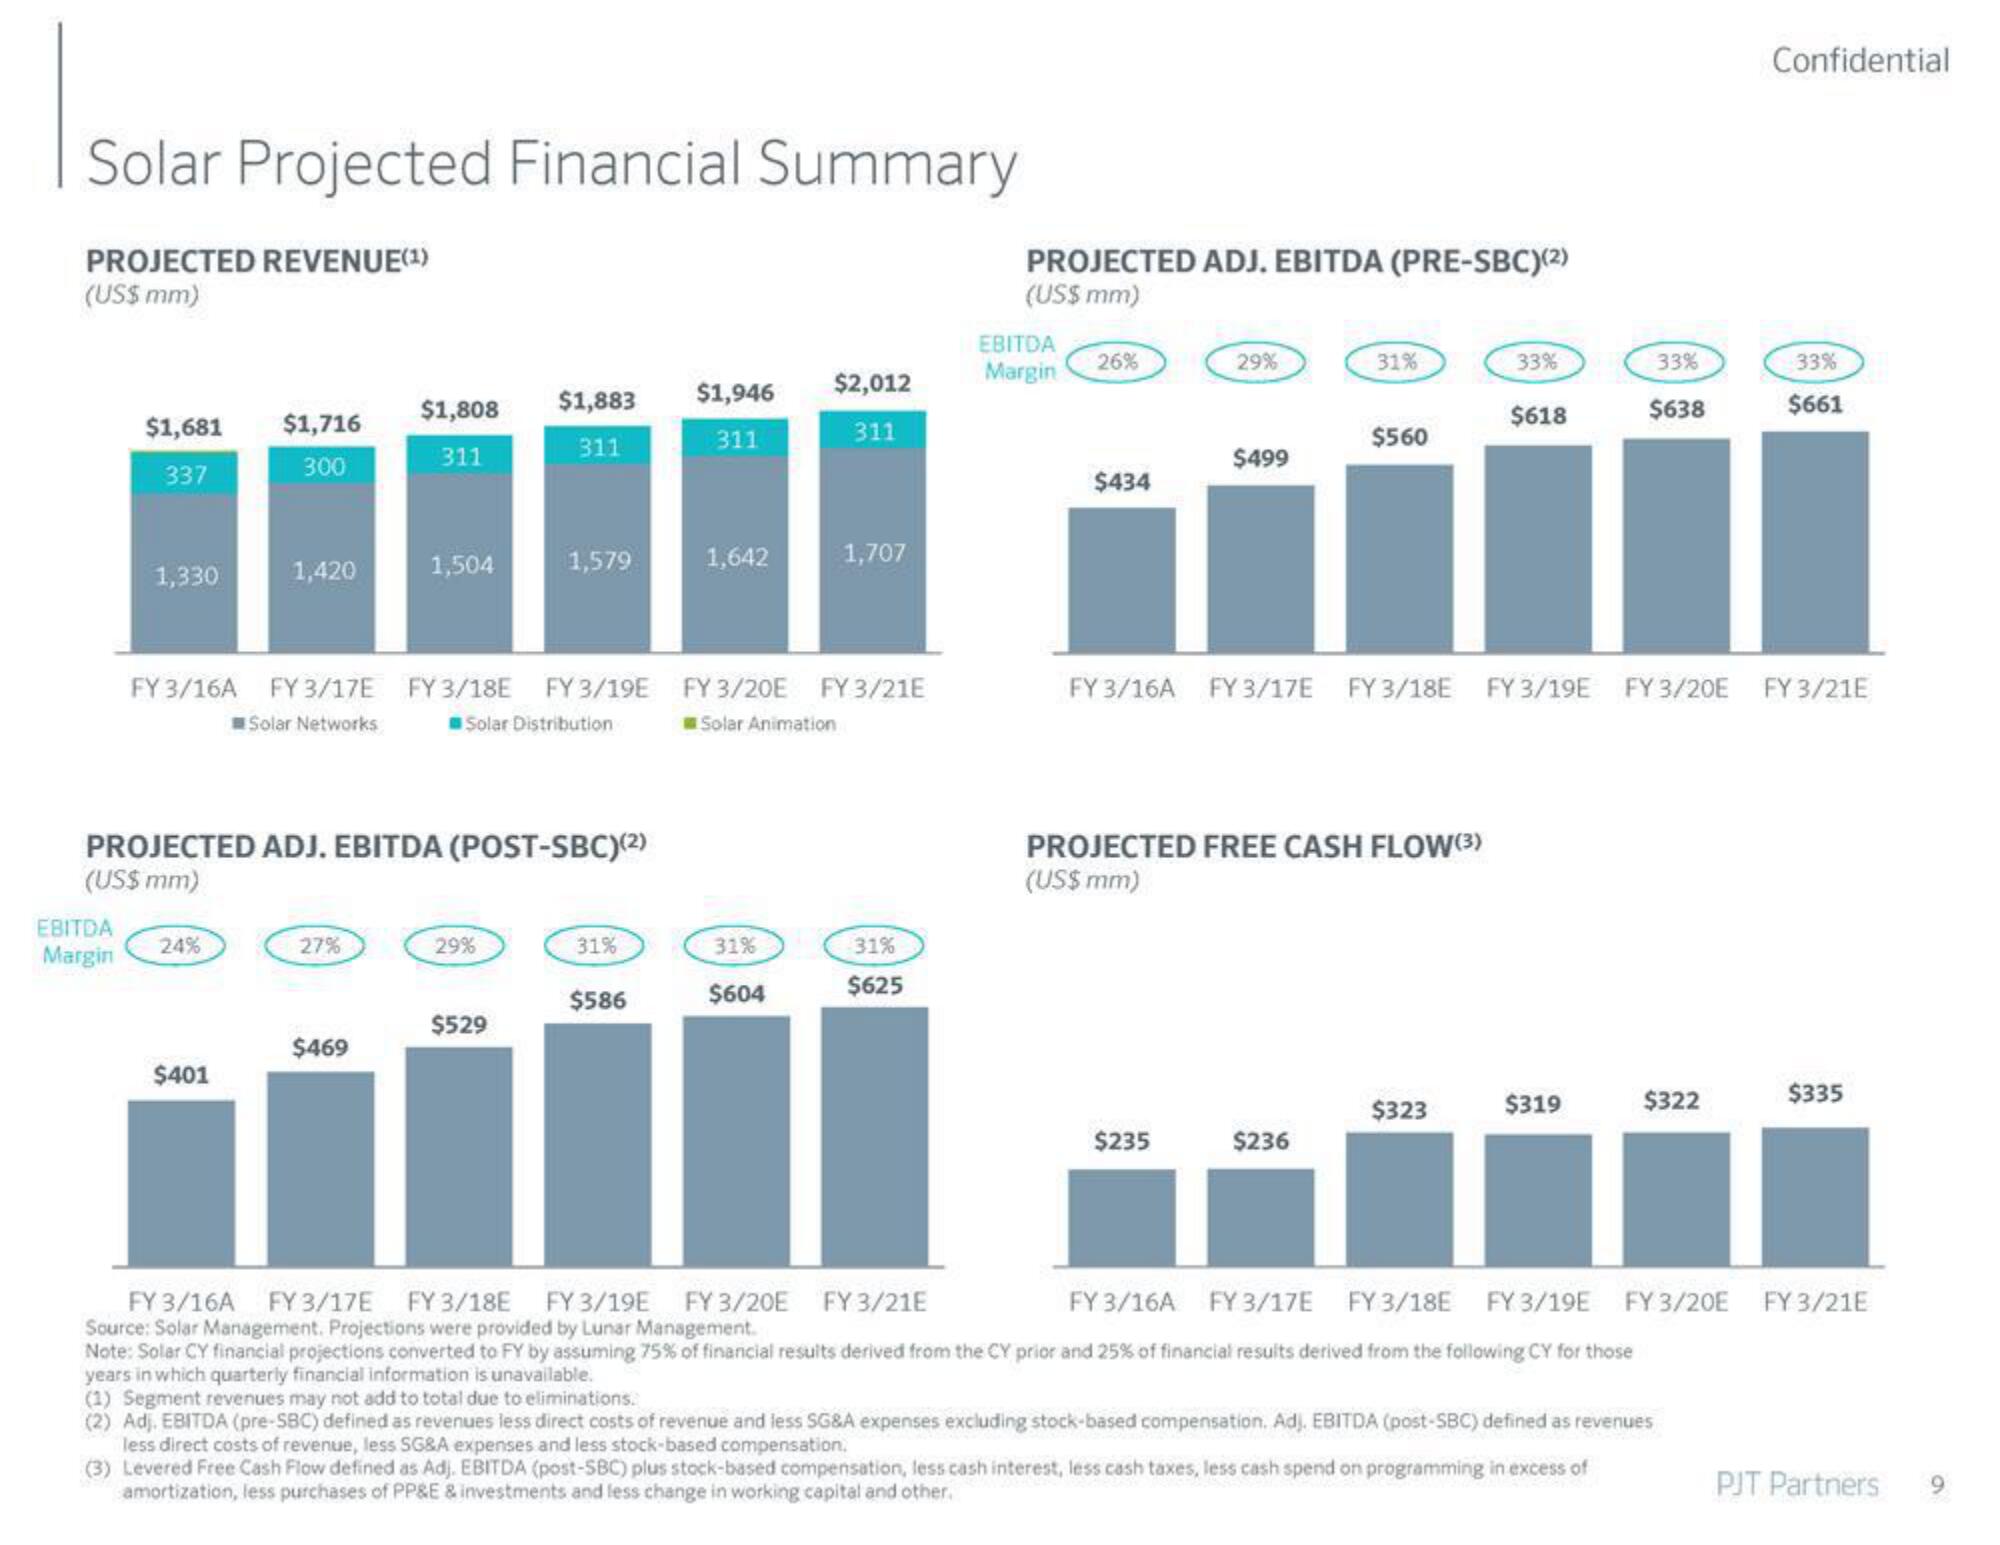
Solar Projected Financial Summary
PROJECTED REVENUE(¹)
(US$ mm)
$1,681
337
EBITDA
Margin
1,330
$1,716
300
24%
1,420
$401
FY 3/16A FY 3/17E FY 3/18E FY 3/19E
Solar Networks
Solar Distribution
PROJECTED ADJ. EBITDA (POST-SBC)(²)
(US$ mm)
$1,808 $1,883
311
311
27%
1,504
$469
1,579
29%
$529
31%
$586
$1,946
311
1,642
$2,012
311
31%
$604
1,707
FY 3/20E FY 3/21E
Solar Animation
31%
$625
PROJECTED ADJ. EBITDA (PRE-SBC)(2)
(US$ mm)
EBITDA
Margin
26%
$434
29%
$499
$235
31%
$560
PROJECTED FREE CASH FLOW(3)
(US$ mm)
$236
33%
$323
$618
FY 3/16A FY 3/17E FY 3/18E FY 3/19E FY 3/20E FY 3/21E
33%
$638
$319
$322
Confidential
FY 3/16A FY 3/17E FY 3/18E FY 3/19E
FY 3/16A FY 3/17E FY 3/18E FY 3/19E FY 3/20E FY 3/21E
Source: Solar Management. Projections were provided by Lunar Management.
Note: Solar CY financial projections converted to FY by assuming 75% of financial results derived from the CY prior and 25% of financial results derived from the following CY for those
years in which quarterly financial information is unavailable.
(1) Segment revenues may not add to total due to eliminations.
(2) Adj. EBITDA (pre-SBC) defined as revenues less direct costs of revenue and less SG&A expenses excluding stock-based compensation. Adj. EBITDA (post-SBC) defined as revenues
less direct costs of revenue, less SG&A expenses and less stock-based compensation.
(3) Levered Free Cash Flow defined as Adj. EBITDA (post-SBC) plus stock-based compensation, less cash interest, less cash taxes, less cash spend on programming in excess of
amortization, less purchases of PP&E & investments and less change in working capital and other.
33%
$661
$335
FY 3/20E FY 3/21E
PJT PartnersView entire presentation