OpenText Investor Presentation Deck
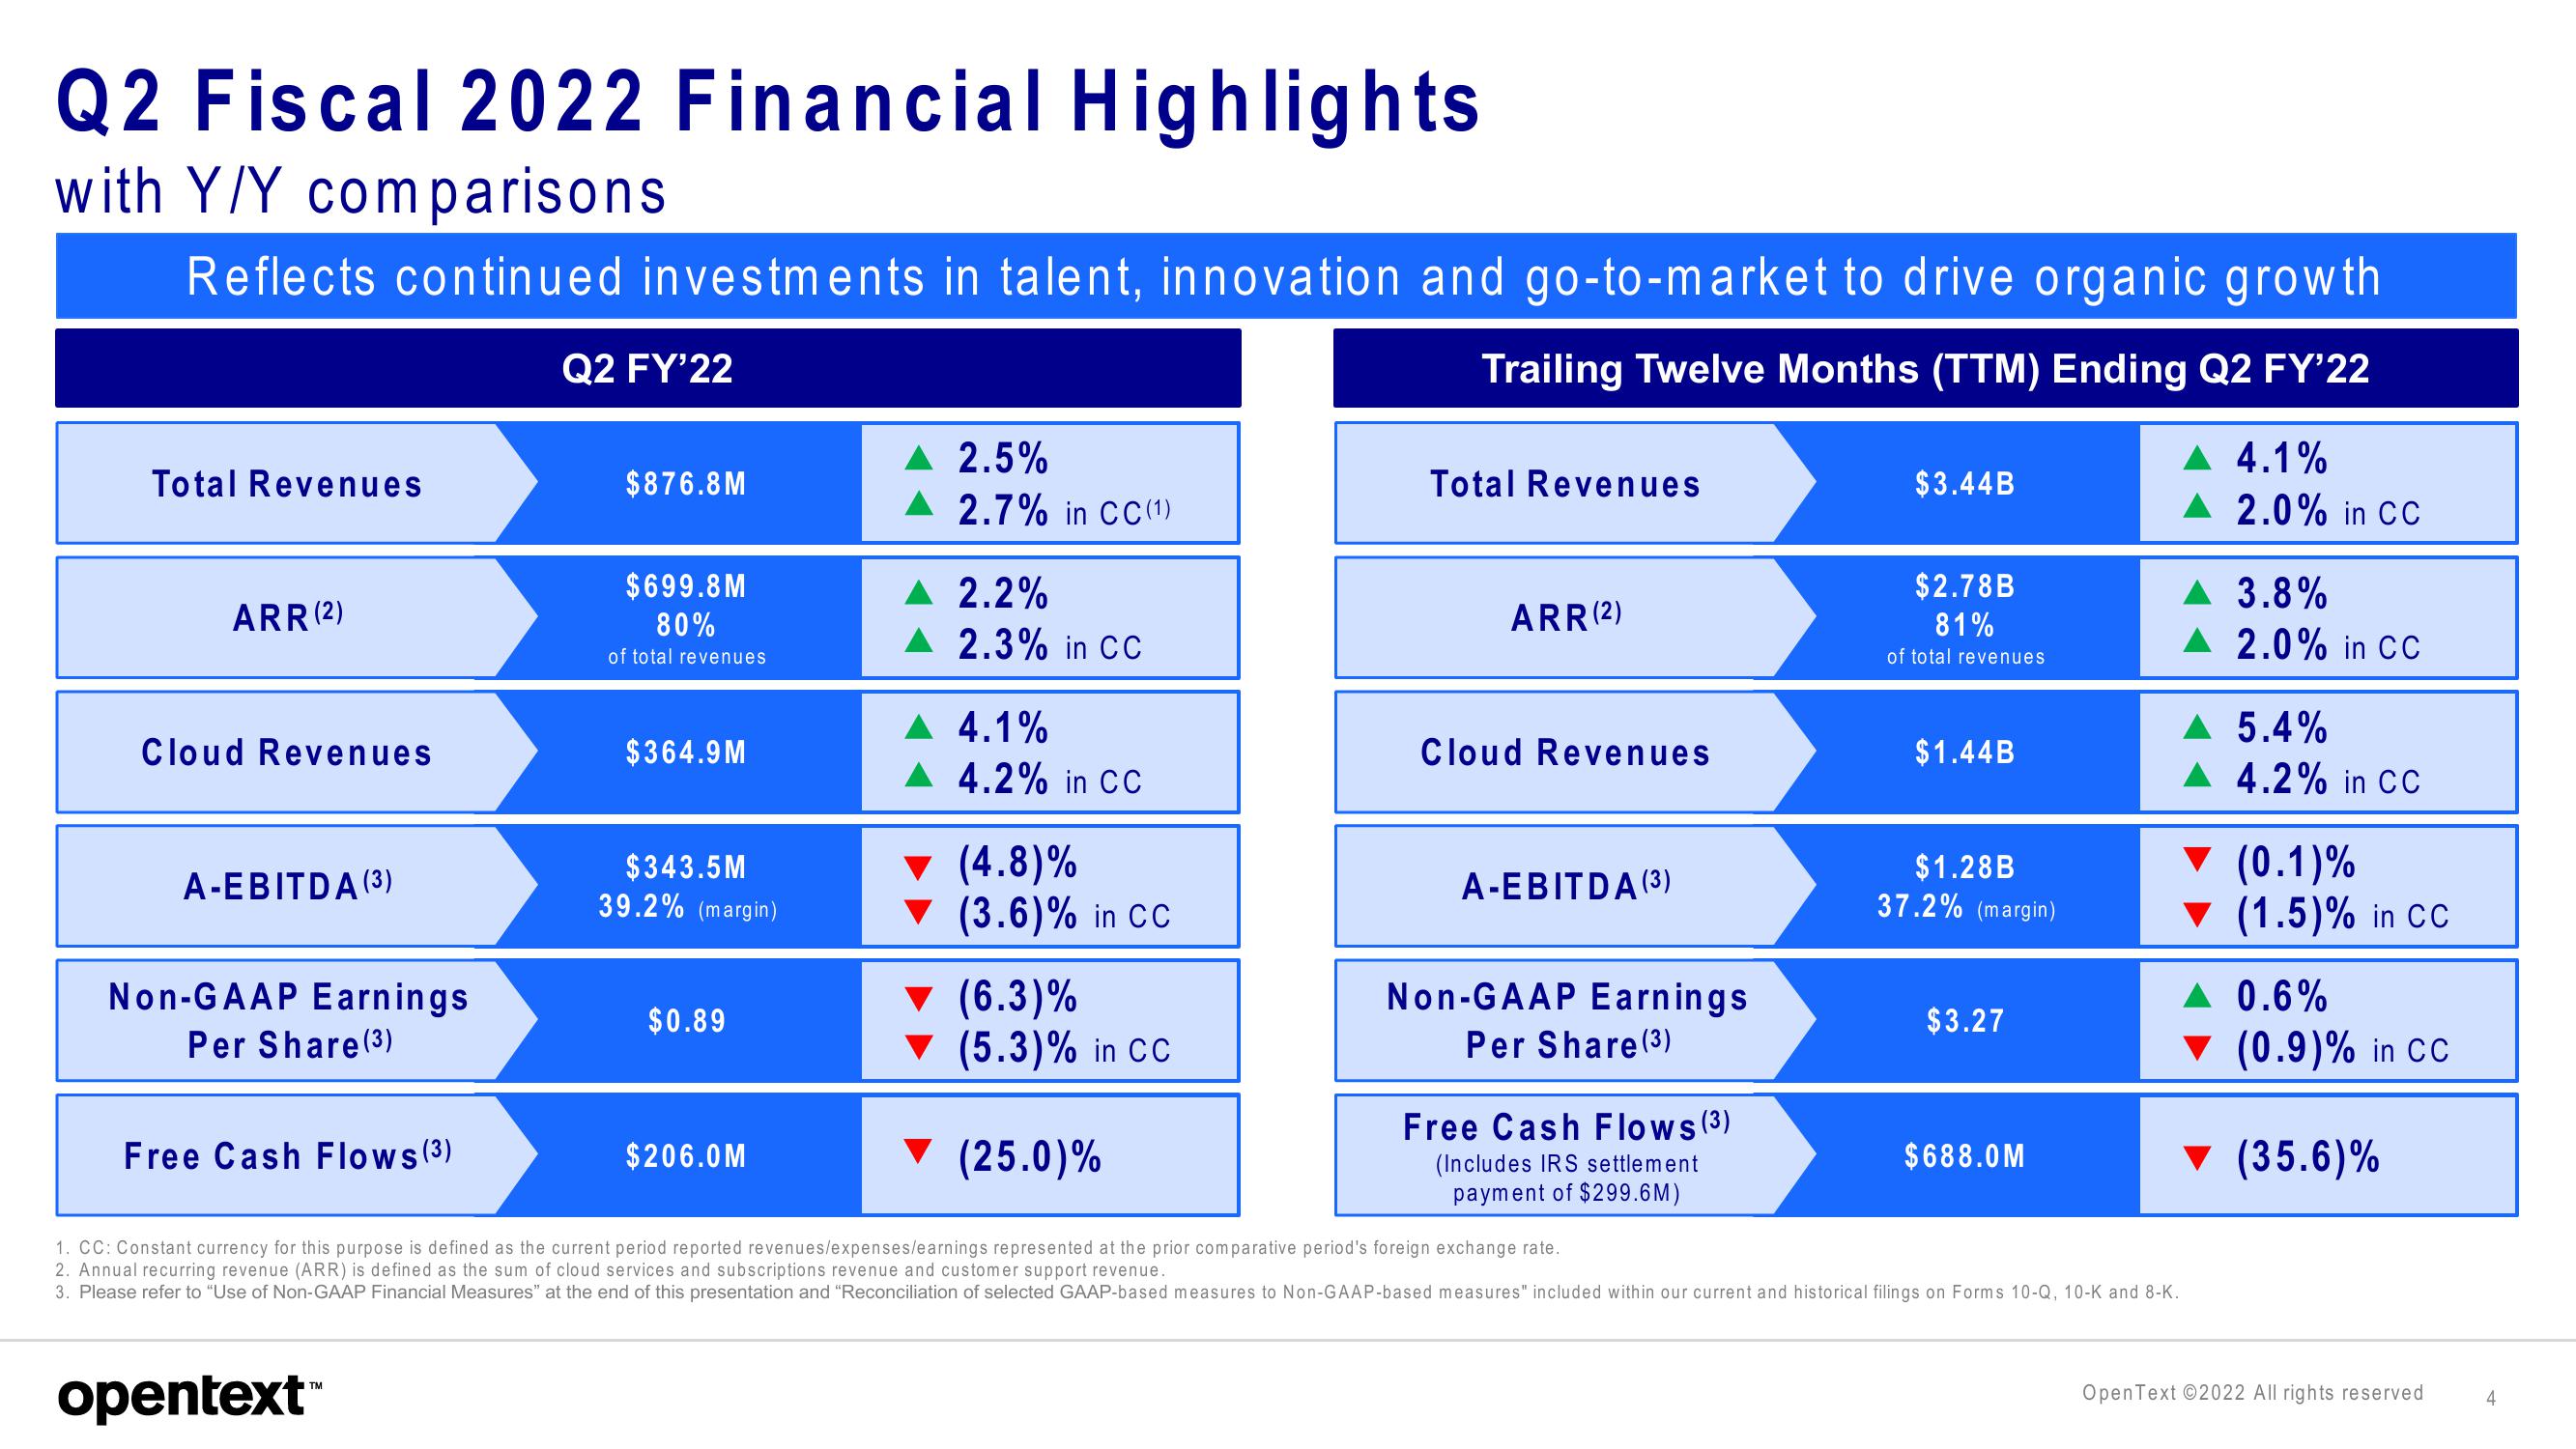
Q2 Fiscal 2022 Financial Highlights
with Y/Y comparisons
Reflects continued investments in talent, innovation and go-to-market to drive organic growth
Trailing Twelve Months (TTM) Ending Q2 FY'22
Total Revenues
ARR (2)
Cloud Revenues
A-EBITDA (3)
Non-GAAP Earnings
Per Share (³)
Free Cash Flows (³)
Q2 FY'22
opentext™
$876.8M
$699.8M
80%
of total revenues
$364.9M
$343.5M
39.2% (margin)
$0.89
$206.0M
▲ 2.5%
▲ 2.7% in CC (1)
▲ 2.2%
▲ 2.3% in CC
▲ 4.1%
4.2% in CC
▼ (4.8)%
▼(3.6)% in CC
▼(6.3)%
(5.3)% in CC
▼ (25.0)%
Total Revenues
ARR (2)
Cloud Revenues
A-EBITDA (3)
Non-GAAP Earnings
Per Share (3)
Free Cash Flows (³)
(Includes IRS settlement
payment of $299.6M)
$3.44B
$2.78B
81%
of total revenues
$1.44B
$1.28B
37.2% (margin)
$3.27
$688.0M
▲ 4.1%
1. CC: Constant currency for this purpose is defined as the current period reported revenues/expenses/earnings represented at the prior comparative period's foreign exchange rate.
2. Annual recurring revenue (ARR) is defined as the sum of cloud services and subscriptions revenue and customer support revenue.
3. Please refer to "Use of Non-GAAP Financial Measures" at the end of this presentation and "Reconciliation of selected GAAP-based measures to Non-GAAP-based measures" included within our current and historical filings on Forms 10-Q, 10-K and 8-K.
2.0% in CC
▲ 3.8%
▲ 2.0% in CC
▲ 5.4%
▲ 4.2% in CC
▼ (0.1)%
▼ (1.5)% in CC
▲ 0.6%
▼ (0.9)% in CC
▼(35.6)%
OpenText ©2022 All rights reserved
4View entire presentation