First Busey Results Presentation Deck
4Q23 Earnings Investor Presentation
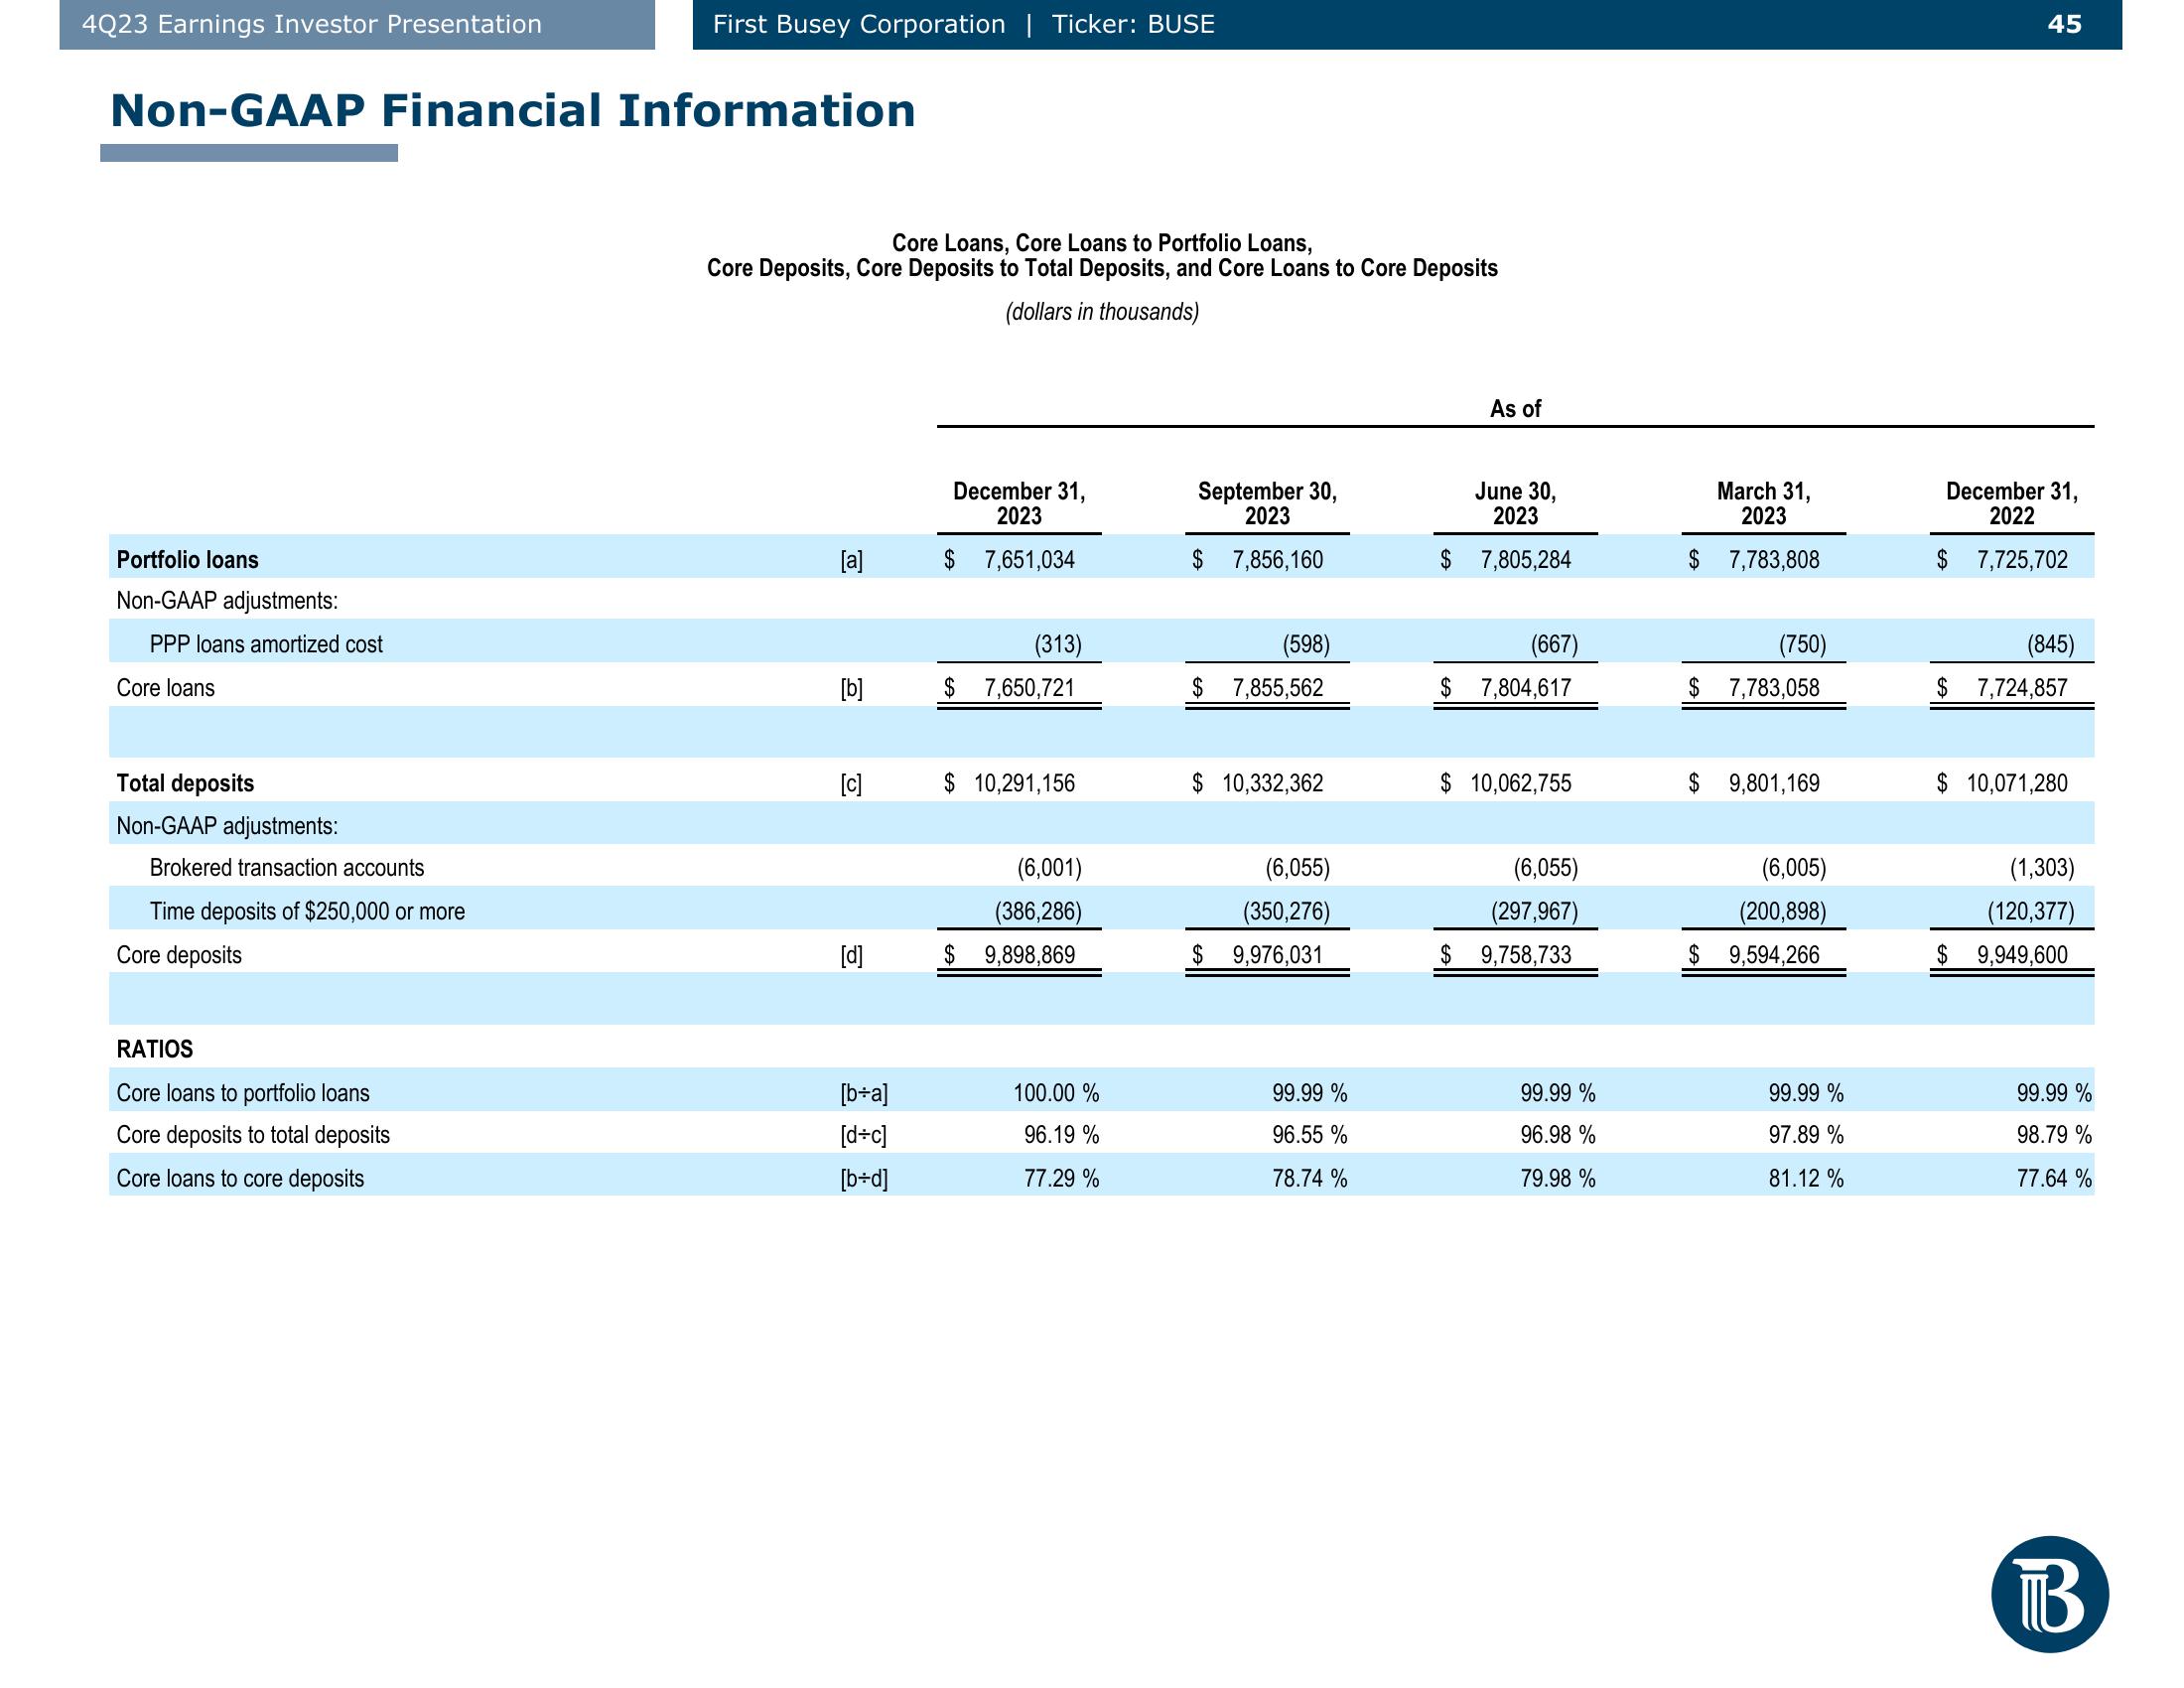
Non-GAAP Financial Information
Portfolio loans
Non-GAAP adjustments:
PPP loans amortized cost
Core loans
Total deposits
Non-GAAP adjustments:
Brokered transaction accounts
Time deposits of $250,000 or more
Core deposits
First Busey Corporation | Ticker: BUSE
RATIOS
Core loans to portfolio loans
Core deposits to total deposits
Core loans to core deposits
Core Loans, Core Loans to Portfolio Loans,
Core Deposits, Core Deposits to Total Deposits, and Core Loans to Core Deposits
(dollars in thousands)
[a]
[b]
[c]
[d]
[b+a]
[d+c]
[b+d]
December 31,
2023
7,651,034
$
(313)
$ 7,650,721
$ 10,291,156
(6,001)
(386,286)
$ 9,898,869
100.00 %
96.19%
77.29%
September 30,
2023
$ 7,856,160
(598)
$ 7,855,562
$ 10,332,362
(6,055)
(350,276)
$ 9,976,031
99.99%
96.55 %
78.74 %
As of
June 30,
2023
$ 7,805,284
(667)
$ 7,804,617
$ 10,062,755
(6,055)
(297,967)
$ 9,758,733
99.99%
96.98 %
79.98 %
March 31,
2023
$ 7,783,808
(750)
$ 7,783,058
$ 9,801,169
(6,005)
(200,898)
$ 9,594,266
99.99%
97.89 %
81.12 %
45
December 31,
2022
$ 7,725,702
(845)
$ 7,724,857
$10,071,280
$
(1,303)
(120,377)
9,949,600
99.99 %
98.79%
77.64 %
BView entire presentation