Central Pacific Financial Results Presentation Deck
[
0/0 AND C&I - PRIMARY AND SECONDARY INDUSTRIES
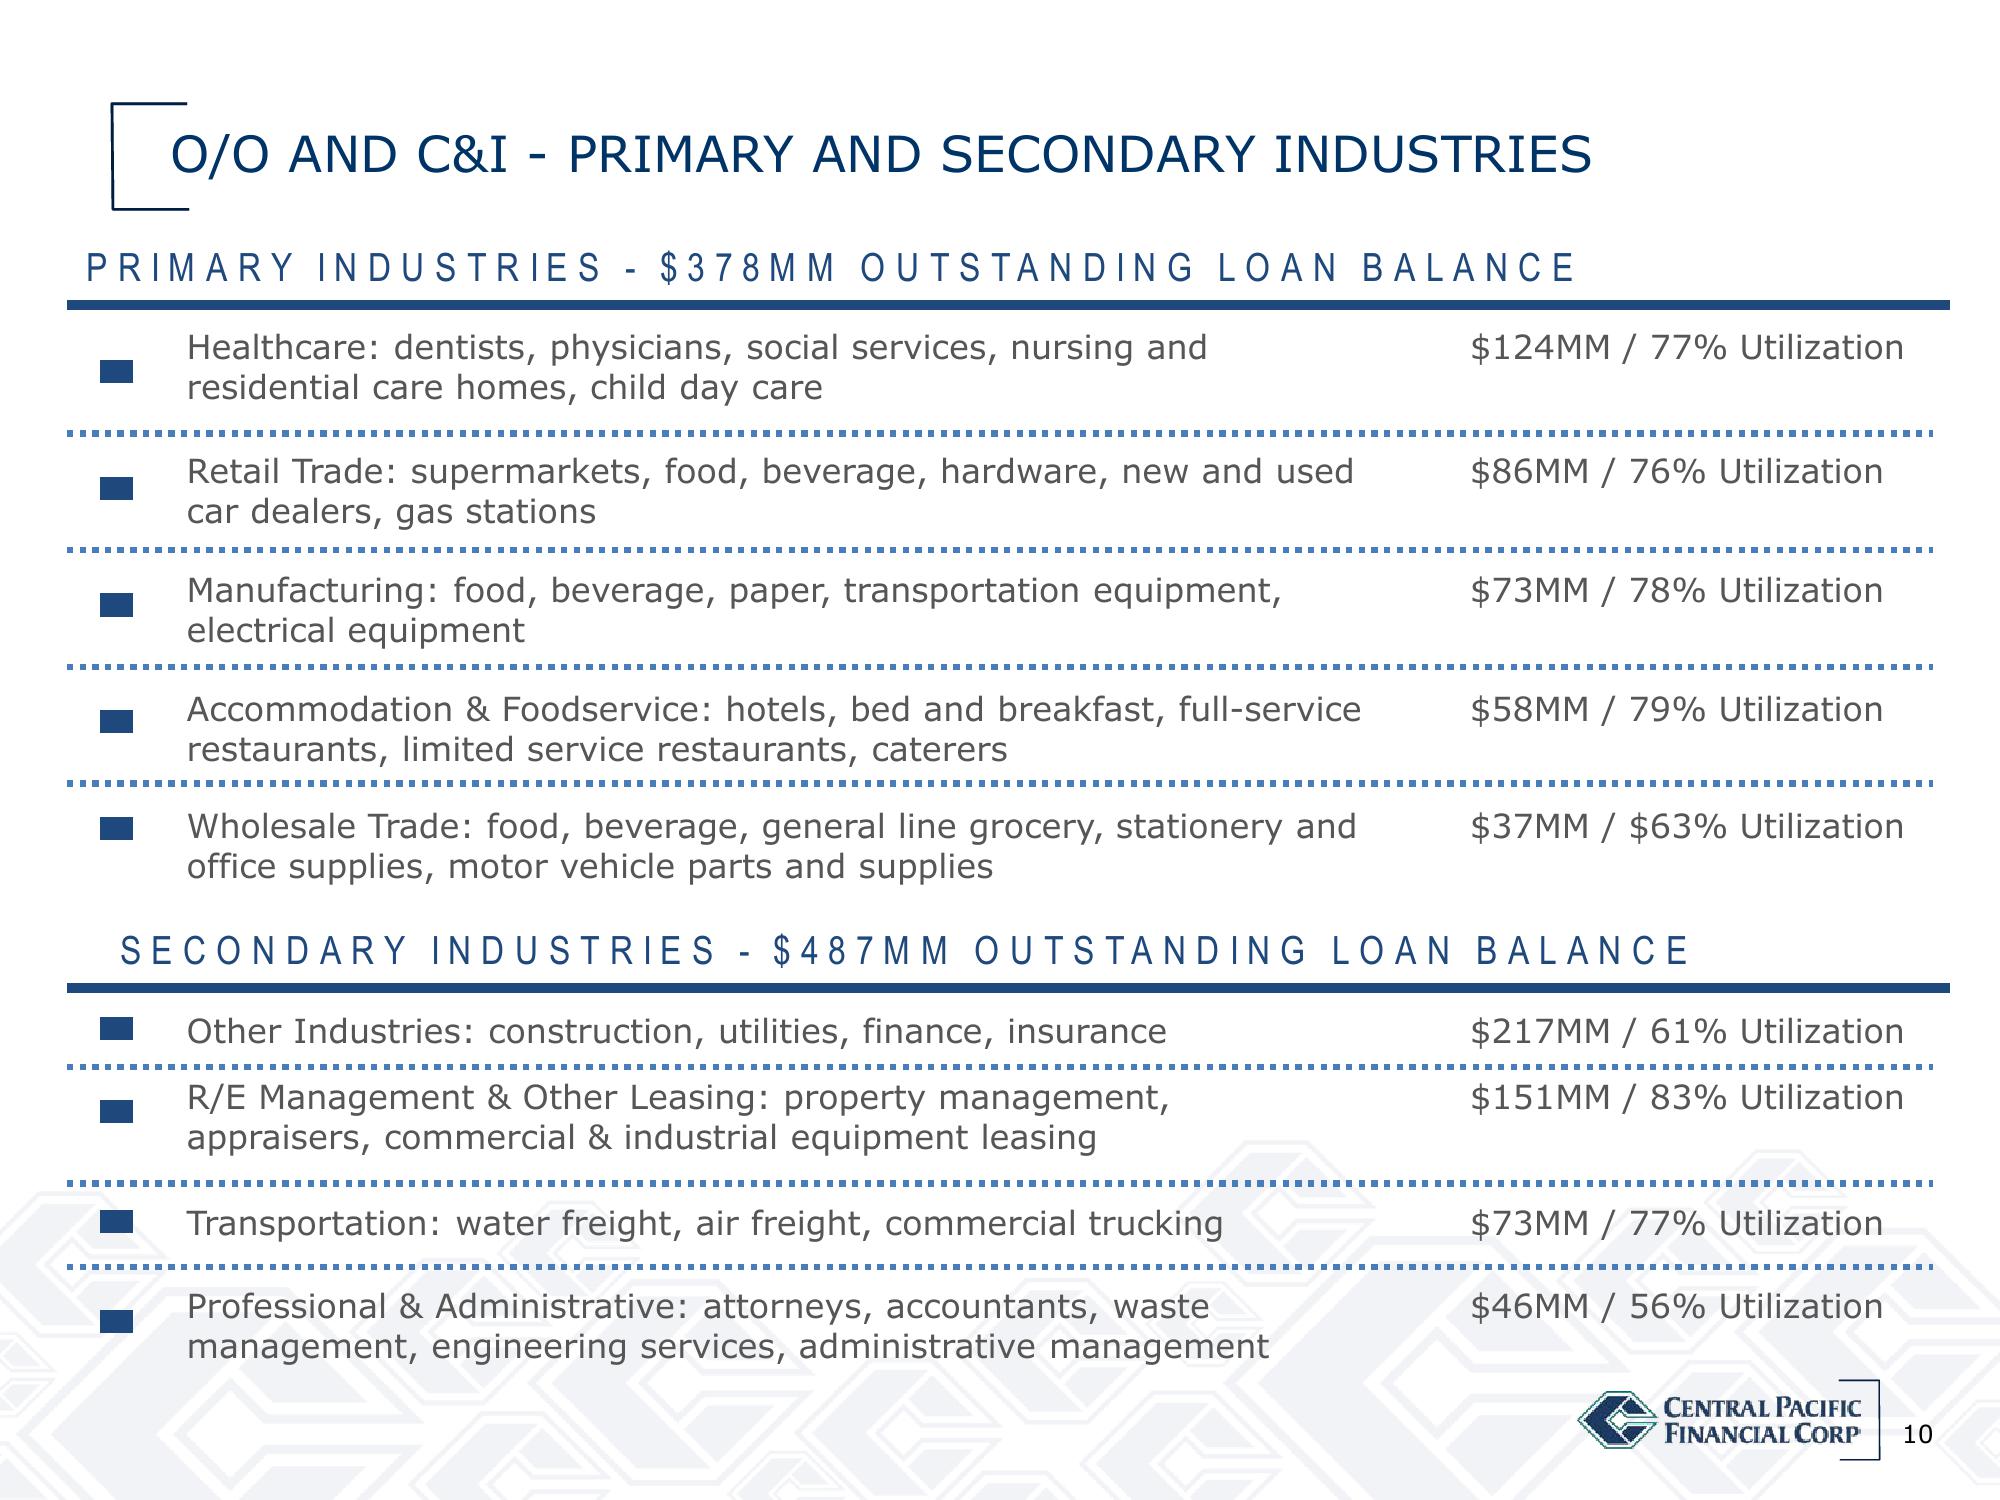
PRIMARY INDUSTRIES - $378MM OUTSTANDING LOAN BALANCE
Healthcare: dentists, physicians, social services, nursing and
residential care homes, child day care
‒‒‒‒‒
I
‒‒‒‒‒‒‒‒‒
‒‒‒‒‒‒
‒‒‒‒‒‒‒‒
Retail Trade: supermarkets, food, beverage, hardware, new and used
car dealers, gas stations
‒‒‒‒‒‒
‒‒‒‒‒‒‒‒‒‒‒
Manufacturing: food, beverage, paper, transportation equipment,
electrical equipment
‒‒‒‒‒‒‒‒‒‒
‒‒‒‒
Accommodation & Foodservice: hotels, bed and breakfast, full-service
restaurants, limited service restaurants, caterers
I
‒‒‒‒
‒‒‒‒‒‒‒‒
‒‒‒‒
‒‒‒‒‒‒‒‒‒‒‒
‒‒‒‒‒‒
‒‒‒‒‒‒‒‒‒
R/E Management & Other Leasing: property management,
appraisers, commercial & industrial equipment leasing
Transportation: water freight, air freight, commercial trucking
Professional & Administrative: attorneys, accountants, waste
management, engineering services, administrative management
$124MM / 77% Utilization
Wholesale Trade: food, beverage, general line grocery, stationery and
office supplies, motor vehicle parts and supplies
SECONDARY INDUSTRIES - $487MM OUTSTANDING LOAN BALANCE
Other Industries: construction, utilities, finance, insurance
‒‒‒‒‒‒
‒‒‒‒‒‒‒‒‒‒‒
$86MM / 76% Utilization
‒‒‒‒‒‒‒‒
‒‒‒‒‒‒‒‒‒‒‒
$73MM / 78% Utilization
‒‒‒‒‒‒‒‒‒
$58MM/ 79% Utilization
‒‒‒‒‒‒‒‒‒‒
‒‒‒‒‒‒
‒‒‒‒‒‒‒‒‒‒‒
$37MM / $63% Utilization
$217MM / 61% Utilization
‒‒‒‒‒‒‒‒‒‒‒
$151MM / 83% Utilization
‒‒‒‒‒‒‒‒‒‒‒
$73MM / 77% Utilization
$46MM / 56% Utilization
‒‒‒‒‒‒‒‒
CENTRAL PACIFIC
FINANCIAL CORP
10View entire presentation