Kinnevik Results Presentation Deck slide image

Kinnevik Results Presentation Deck

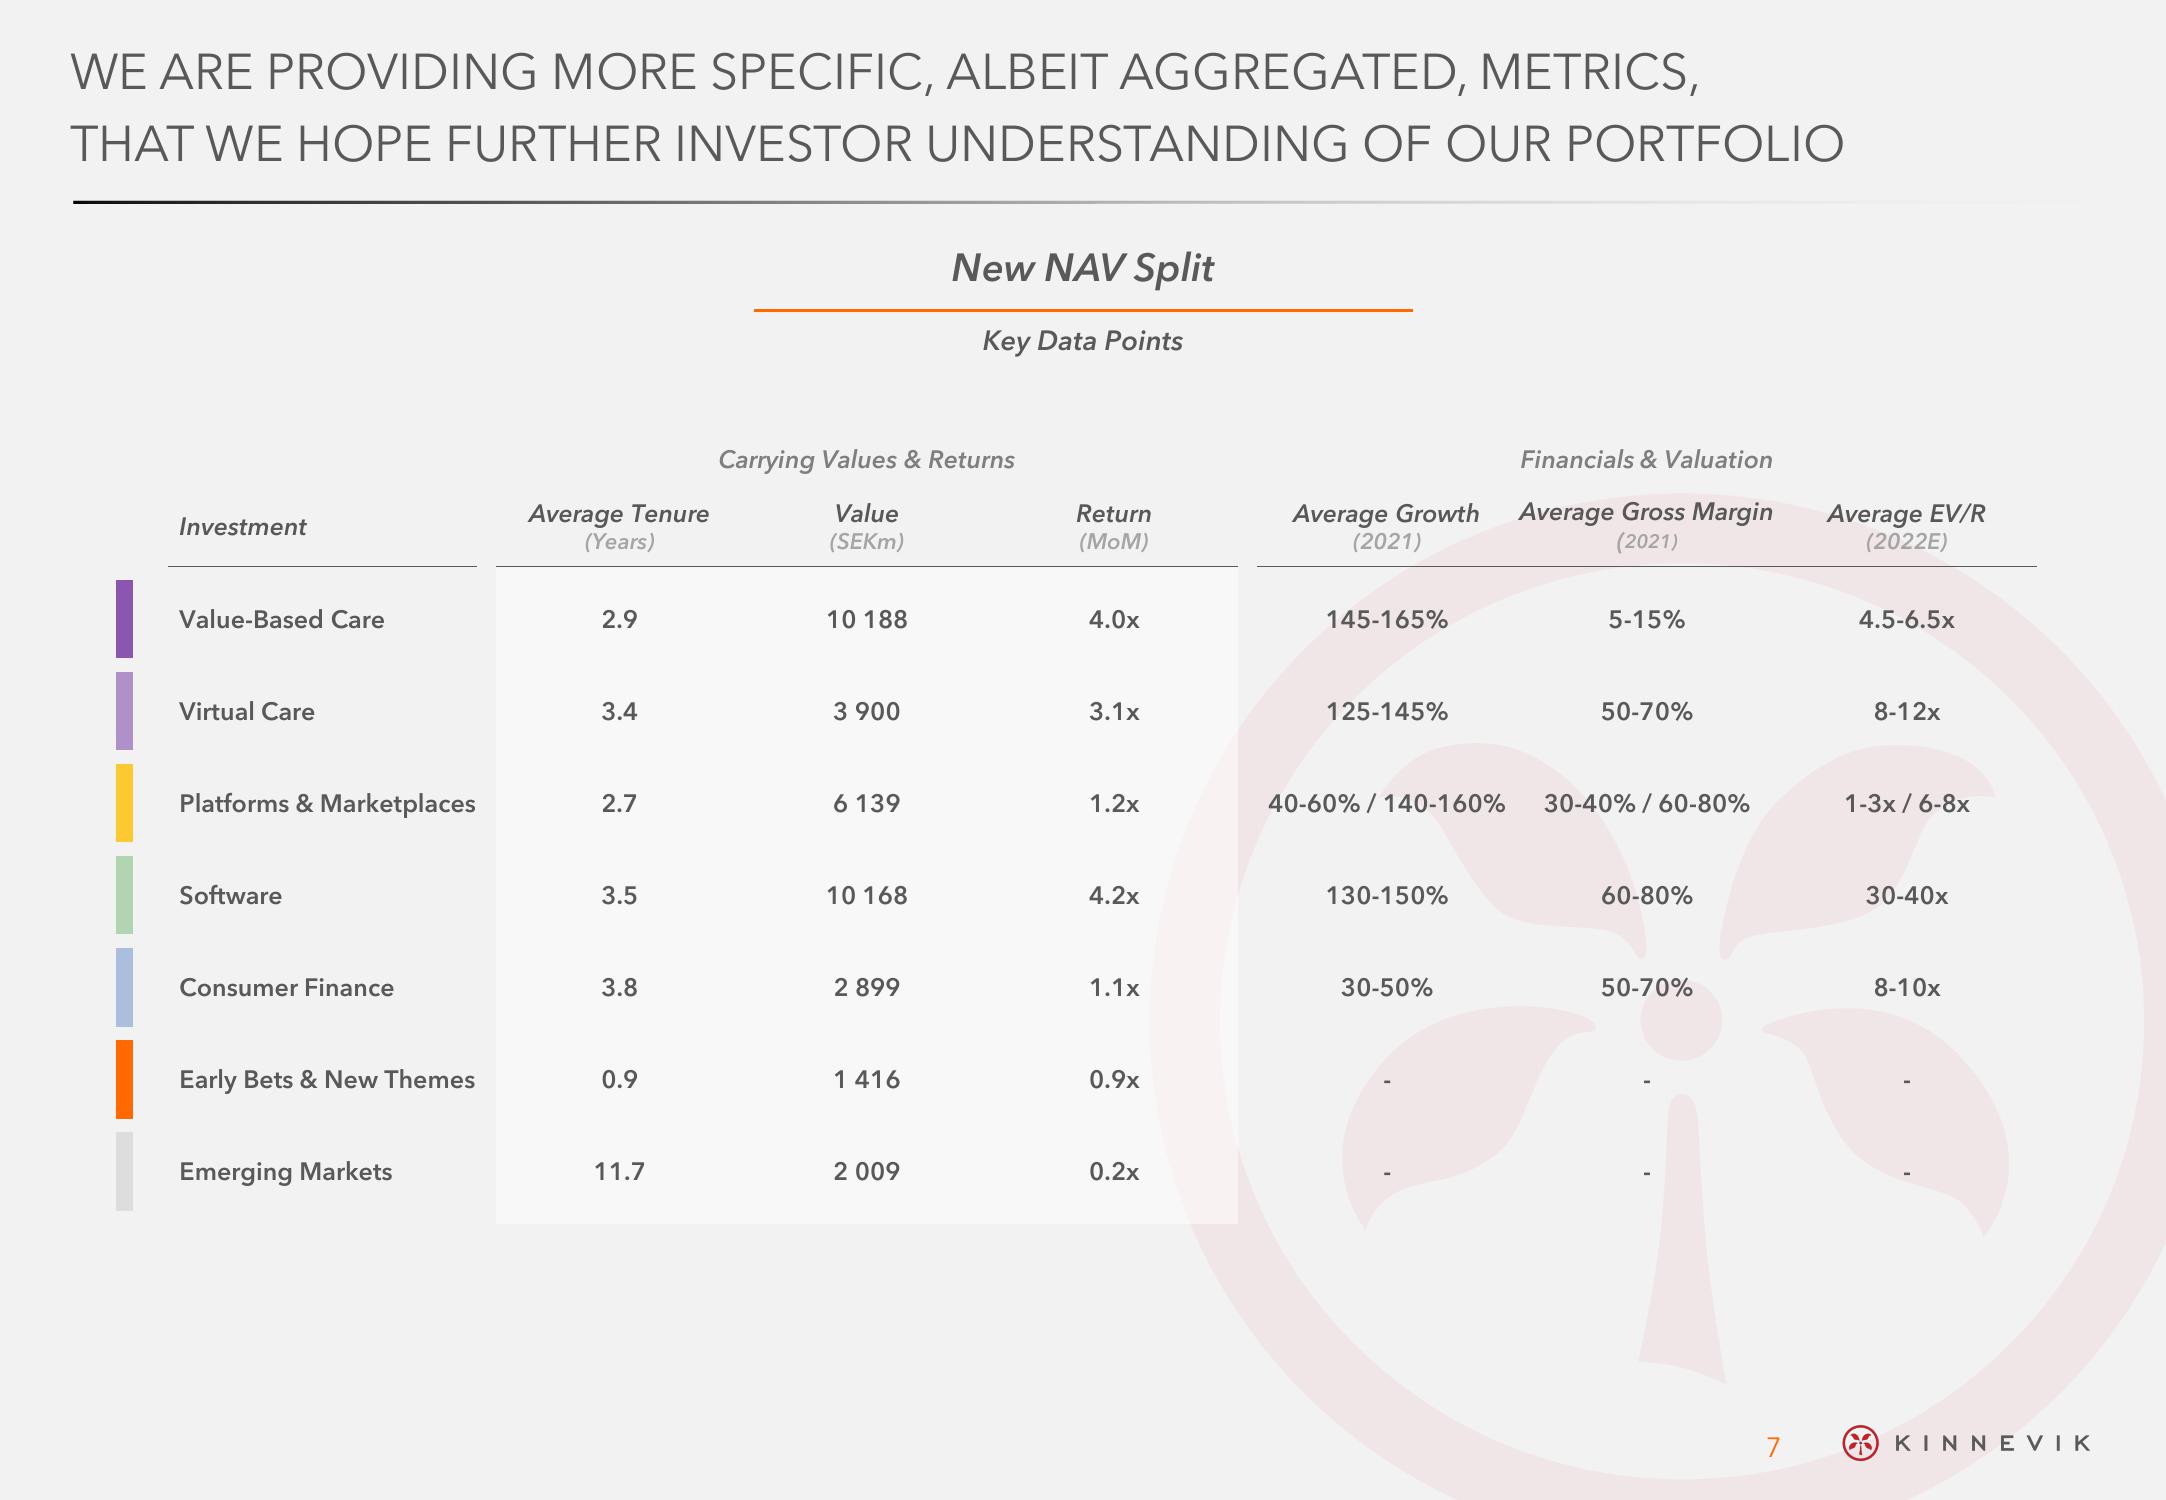
WE ARE PROVIDING MORE SPECIFIC, ALBEIT AGGREGATED, METRICS, THAT WE HOPE FURTHER INVESTOR UNDERSTANDING OF OUR PORTFOLIO Investment Value-Based Care Virtual Care Platforms & Marketplaces Software Consumer Finance Early Bets & New Themes Emerging Markets Average Tenure (Years) 2.9 3.4 2.7 3.5 3.8 0.9 11.7 Carrying Values & Returns Value (SEKm) 10 188 3 900 6 139 10 168 2 899 1 416 New NAV Split Key Data Points 2 009 Return (MoM) 4.0x 3.1x 1.2x 4.2x 1.1x 0.9x 0.2x Average Growth (2021) 145-165% 125-145% 130-150% Financials & Valuation Average Gross Margin (2021) 30-50% 5-15% 40-60% / 140-160% 30-40% / 60-80% 50-70% 60-80% 50-70% 7 Average EV/R (2022E) 4.5-6.5x 8-12x 1-3x/6-8x 30-40x 8-10x KINNEVIK
View entire presentation