NVIDIA Investor Presentation Deck
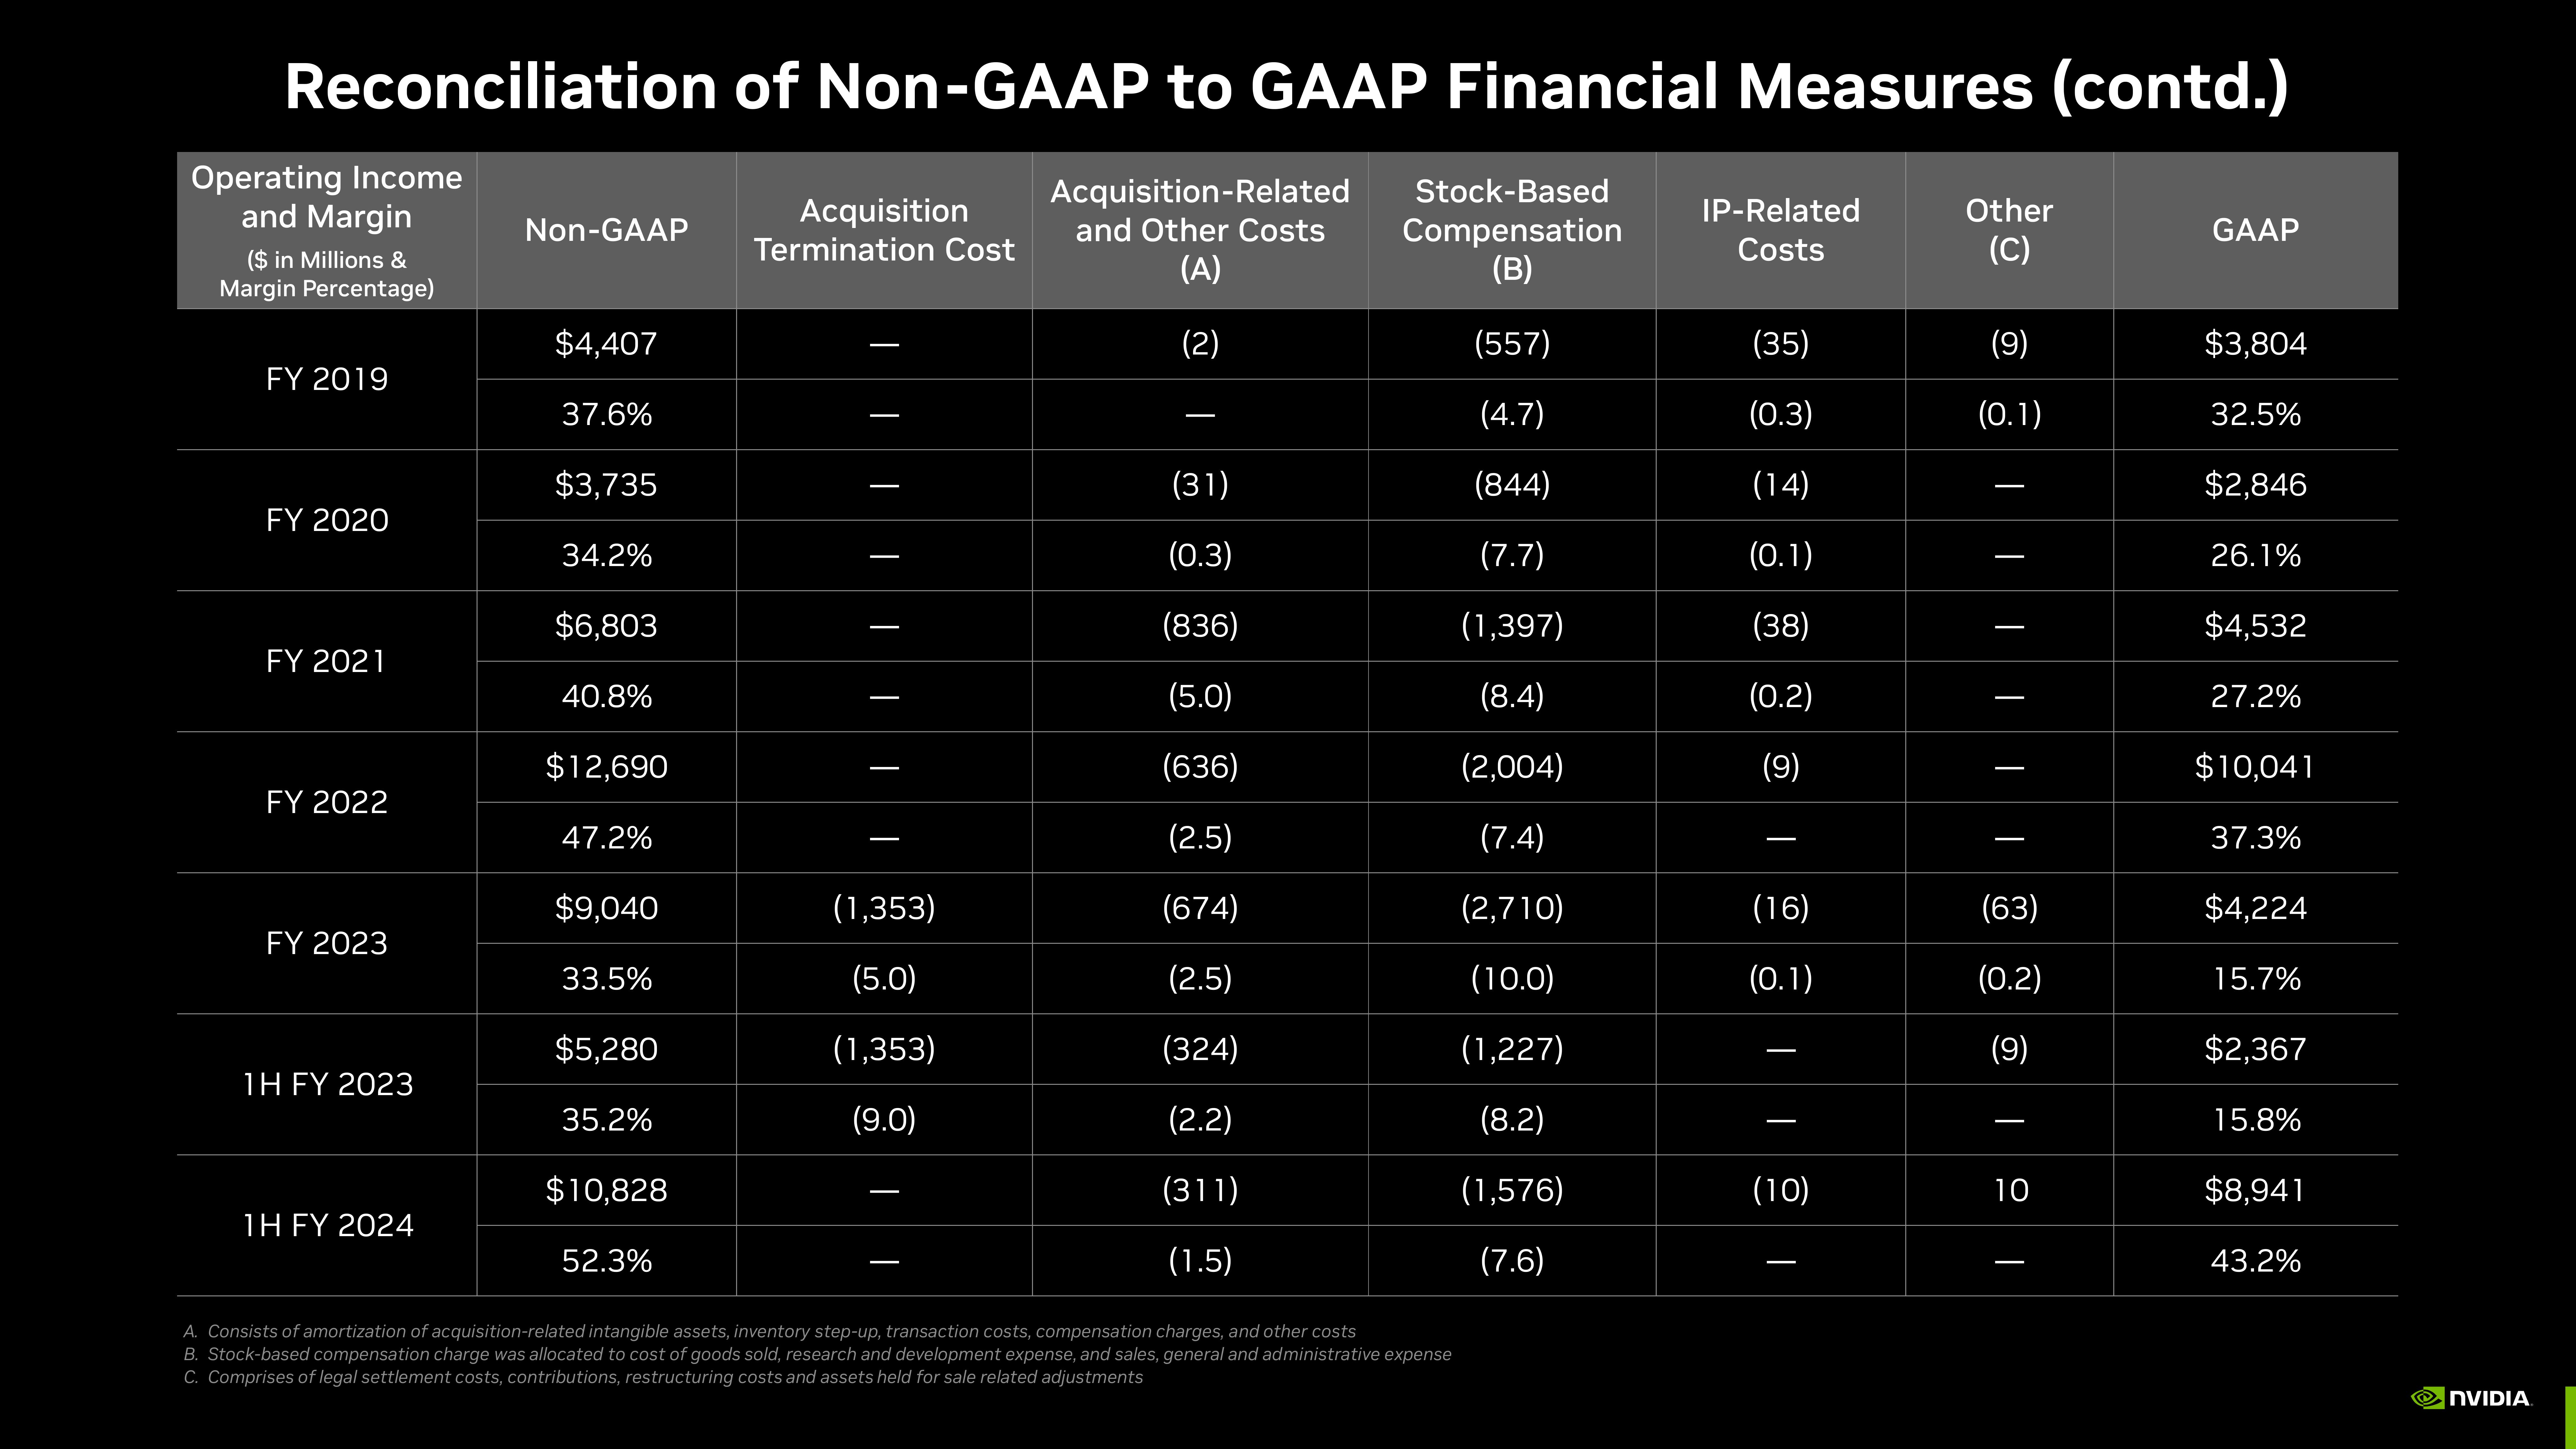
Reconciliation of Non-GAAP to GAAP Financial Measures (contd.)
Acquisition-Related
and Other Costs
(A)
(2)
Operating Income
and Margin
($ in Millions &
Margin Percentage)
FY 2019
FY 2020
FY 2021
FY 2022
FY 2023
1H FY 2023
1H FY 2024
Non-GAAP
$4,407
37.6%
$3,735
34.2%
$6,803
40.8%
$12,690
47.2%
$9,040
33.5%
$5,280
35.2%
$10,828
52.3%
Acquisition
Termination Cost
|||
I
(1,353)
(5.0)
(1,353)
(9.0)
.
|
(31)
(0.3)
(836)
(5.0)
(636)
(2.5)
(674)
(2.5)
(324)
(2.2)
(311)
(1.5)
Stock-Based
Compensation
(B)
(557)
(4.7)
(844)
(7.7)
(1,397)
(8.4)
(2,004)
(7.4)
(2,710)
(10.0)
(1,227)
(8.2)
(1,576)
(7.6)
A. Consists of amortization of acquisition-related intangible assets, inventory step-up, transaction costs, compensation charges, and other costs
B. Stock-based compensation charge was allocated to cost of goods sold, research and development expense, and sales, general and administrative expense
C. Comprises of legal settlement costs, contributions, restructuring costs and assets held for sale related adjustments
IP-Related
Costs
(35)
(0.3)
(14)
(0.1)
(38)
(0.2)
(9)
(16)
(0.1)
(10)
I
Other
(C)
(9)
(0.1)
|
|
I
|
|
I
(63)
(0.2)
(9)
I
10
|
GAAP
$3,804
32.5%
$2,846
26.1%
$4,532
27.2%
$10,041
37.3%
$4,224
15.7%
$2,367
15.8%
$8,941
43.2%
NVIDIAView entire presentation