Better Results Presentation Deck
Homeownership
market is enormous
●
●
Annual spend within the housing market
accounted for on average $3 trillion per
year, 15-18% of US GDP since 2001¹
Since 2013, over 90% of new homes
were purchased with a mortgage²
• For average households, home equity
totals over 35% of net worth³
• In general, all mortgage transactions
require at least one insurance product
Better
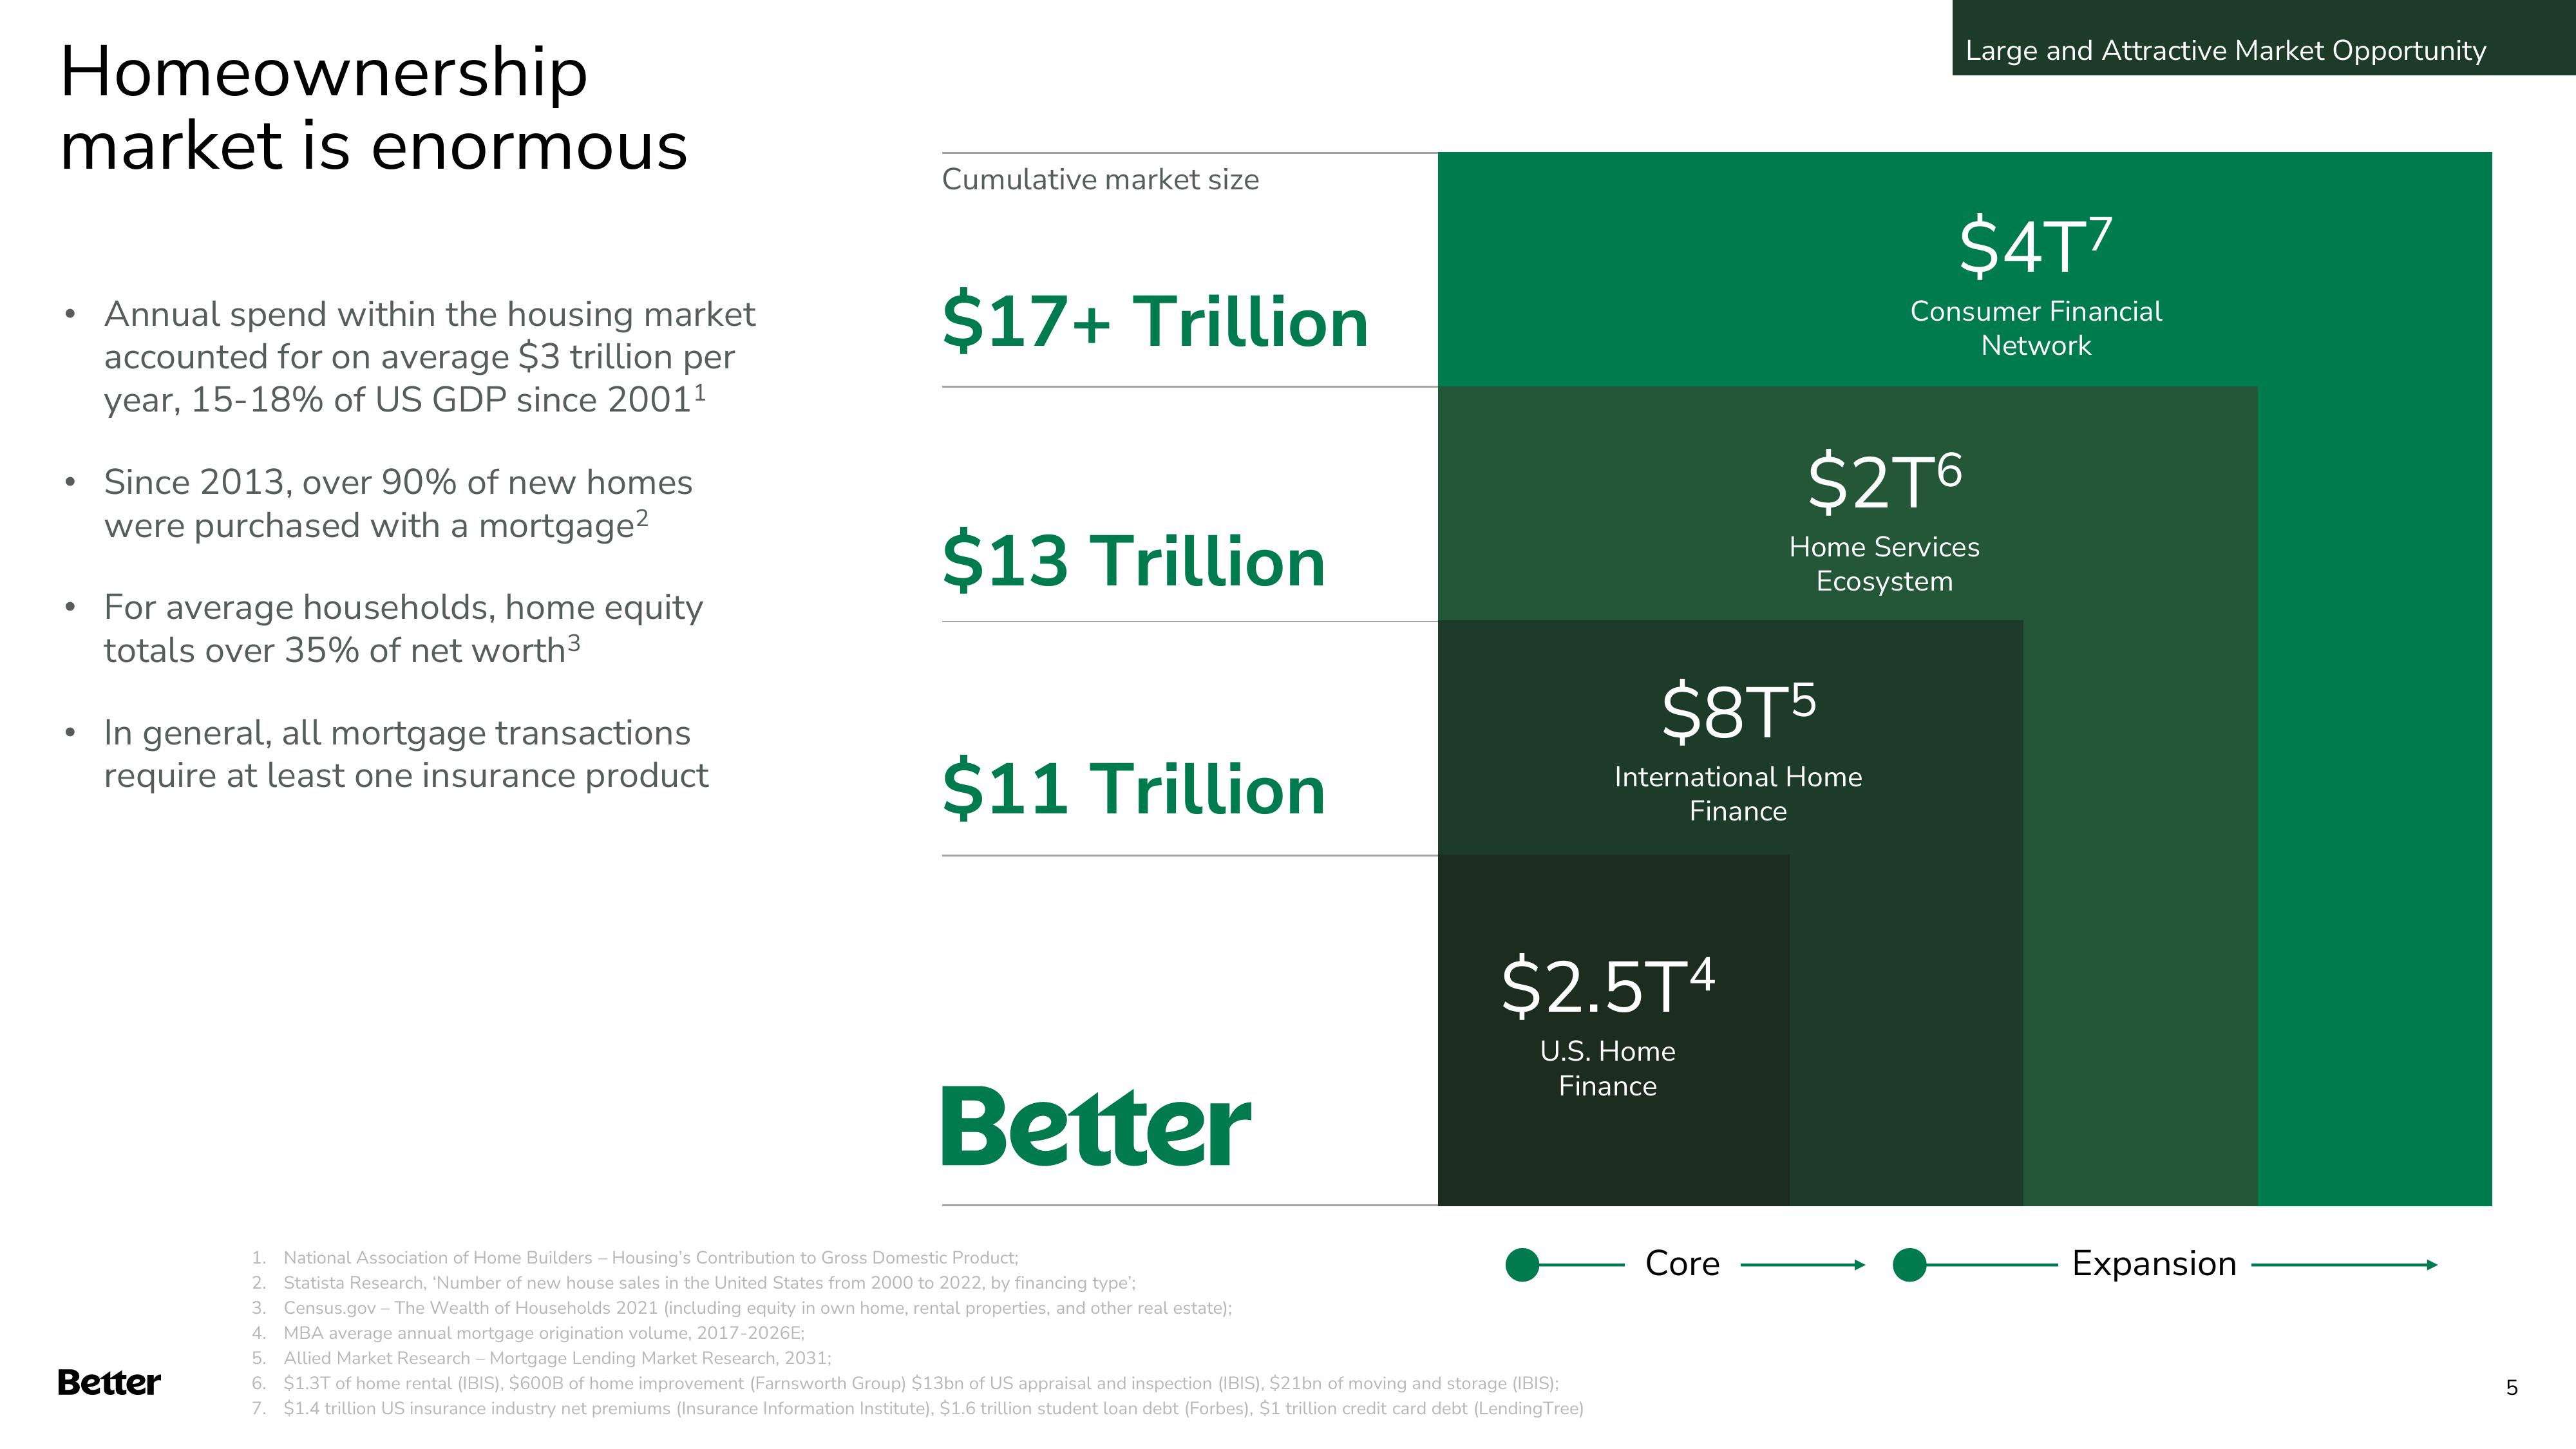
Cumulative market size
$17+ Trillion
$13 Trillion
$11 Trillion
Better
$2.5T4
U.S. Home
Finance
1. National Association of Home Builders - Housing's Contribution to Gross Domestic Product;
2.
Statista Research, 'Number of new house sales in the United States from 2000 to 2022, by financing type';
3. Census.gov - The Wealth of Households 2021 (including equity in own home, rental properties, and other real estate);
4. MBA average annual mortgage origination volume, 2017-2026E;
5. Allied Market Research - Mortgage Lending Market Research, 2031;
6. $1.3T of home rental (IBIS). $600B of home improvement (Farnsworth Group) $13bn of US appraisal and inspection (IBIS), $21bn of moving and storage (IBIS);
7. $1.4 trillion US insurance industry net premiums (Insurance Information Institute), $1.6 trillion student loan debt (Forbes), $1 trillion credit card debt (Lending Tree)
$8T5
International Home
Finance
Core
Large and Attractive Market Opportunity
$4T7
Consumer Financial
Network
$2T6
Home Services
Ecosystem
Expansion
5View entire presentation