jetBlue Results Presentation Deck
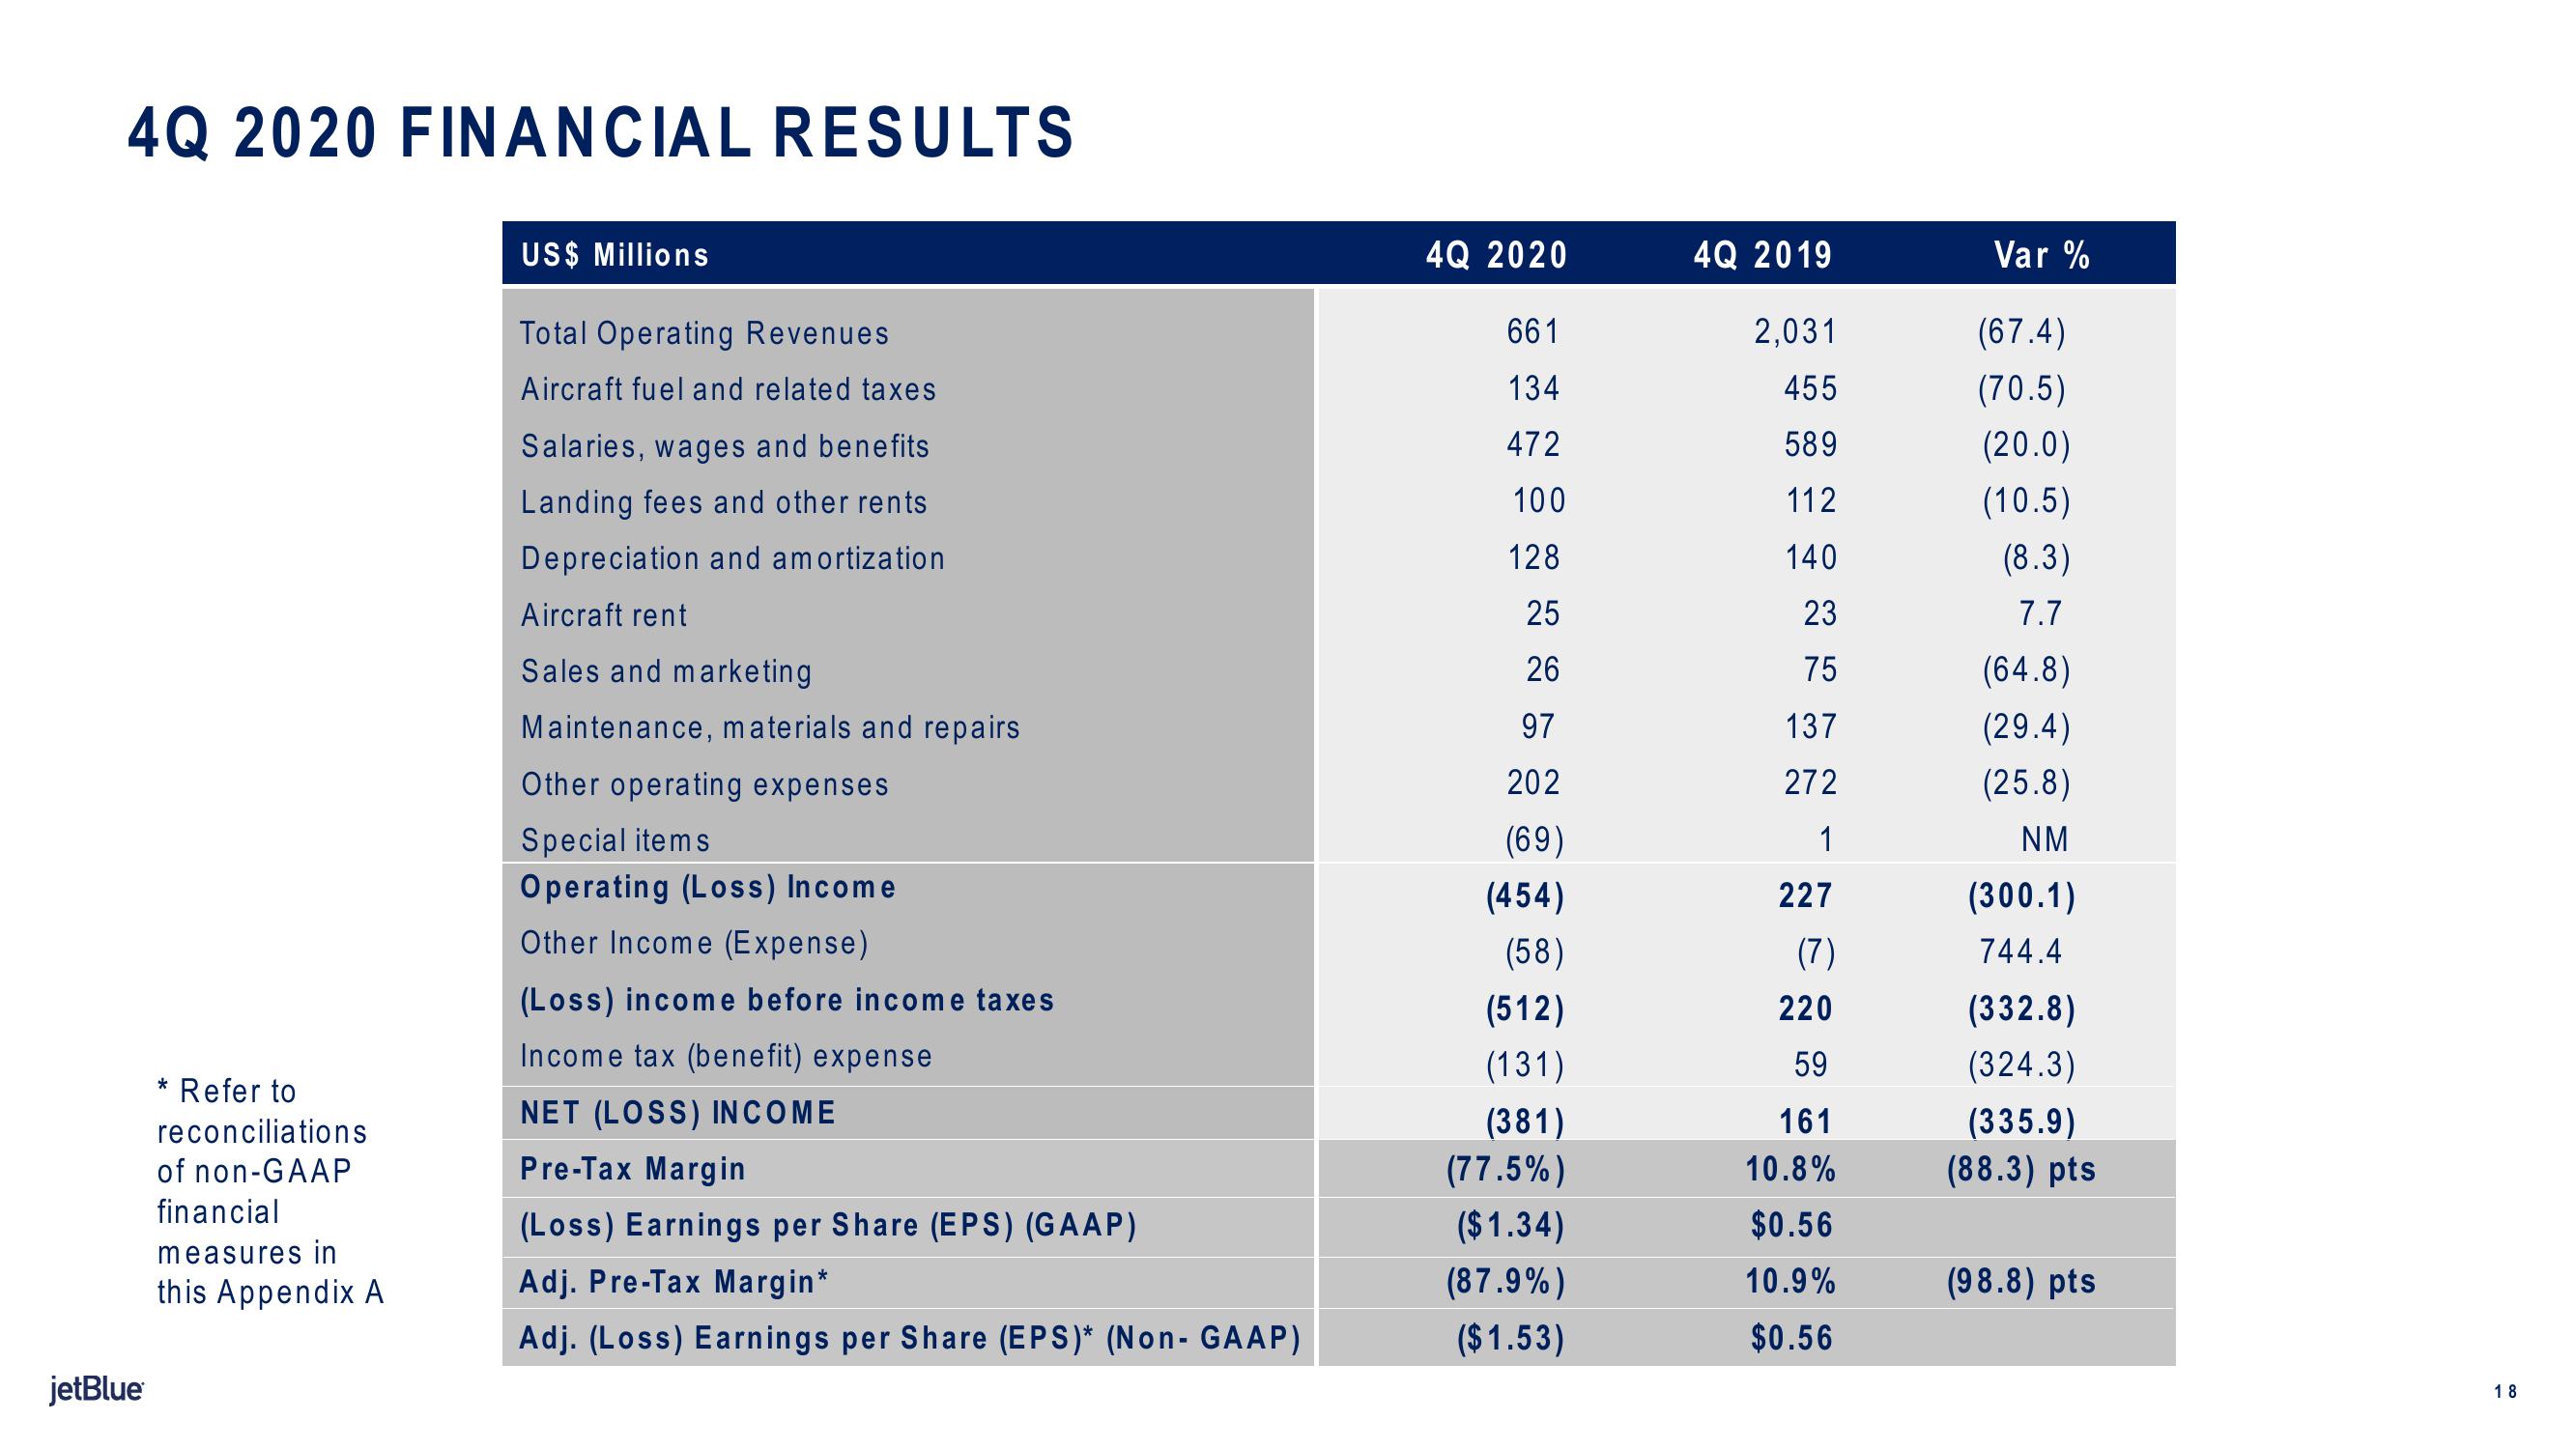
4Q 2020 FINANCIAL RESULTS
jetBlue
* Refer to
reconciliations
of non-GAAP
financial
measures in
this Appendix A
US$ Millions
Total Operating Revenues
Aircraft fuel and related taxes
Salaries, wages and benefits
Landing fees and other rents
Depreciation and amortization
Aircraft rent
Sales and marketing
Maintenance, materials and repairs
Other operating expenses
Special items
Operating (Loss) Income
Other Income (Expense)
(Loss) income before income taxes
Income tax (benefit) expense
NET (LOSS) INCOME
Pre-Tax Margin
(Loss) Earnings per Share (EPS) (GAAP)
Adj. Pre-Tax Margin*
Adj. (Loss) Earnings per Share (EPS)* (Non- GAAP)
4Q 2020
661
134
472
100
128
25
26
97
202
(69)
(454)
(58)
(512)
(131)
(381)
(77.5%)
($1.34)
(87.9%)
($1.53)
4Q 2019
2,031
455
589
112
140
23
75
137
272
1
227
(7)
220
59
161
10.8%
$0.56
10.9%
$0.56
Var %
(67.4)
(70.5)
(20.0)
(10.5)
(8.3)
7.7
(64.8)
(29.4)
(25.8)
NM
(300.1)
744.4
(332.8)
(324.3)
(335.9)
(88.3) pts
(98.8) pts
18View entire presentation