Intermedia IPO Presentation Deck
Long-Term Financial Profile
IIII
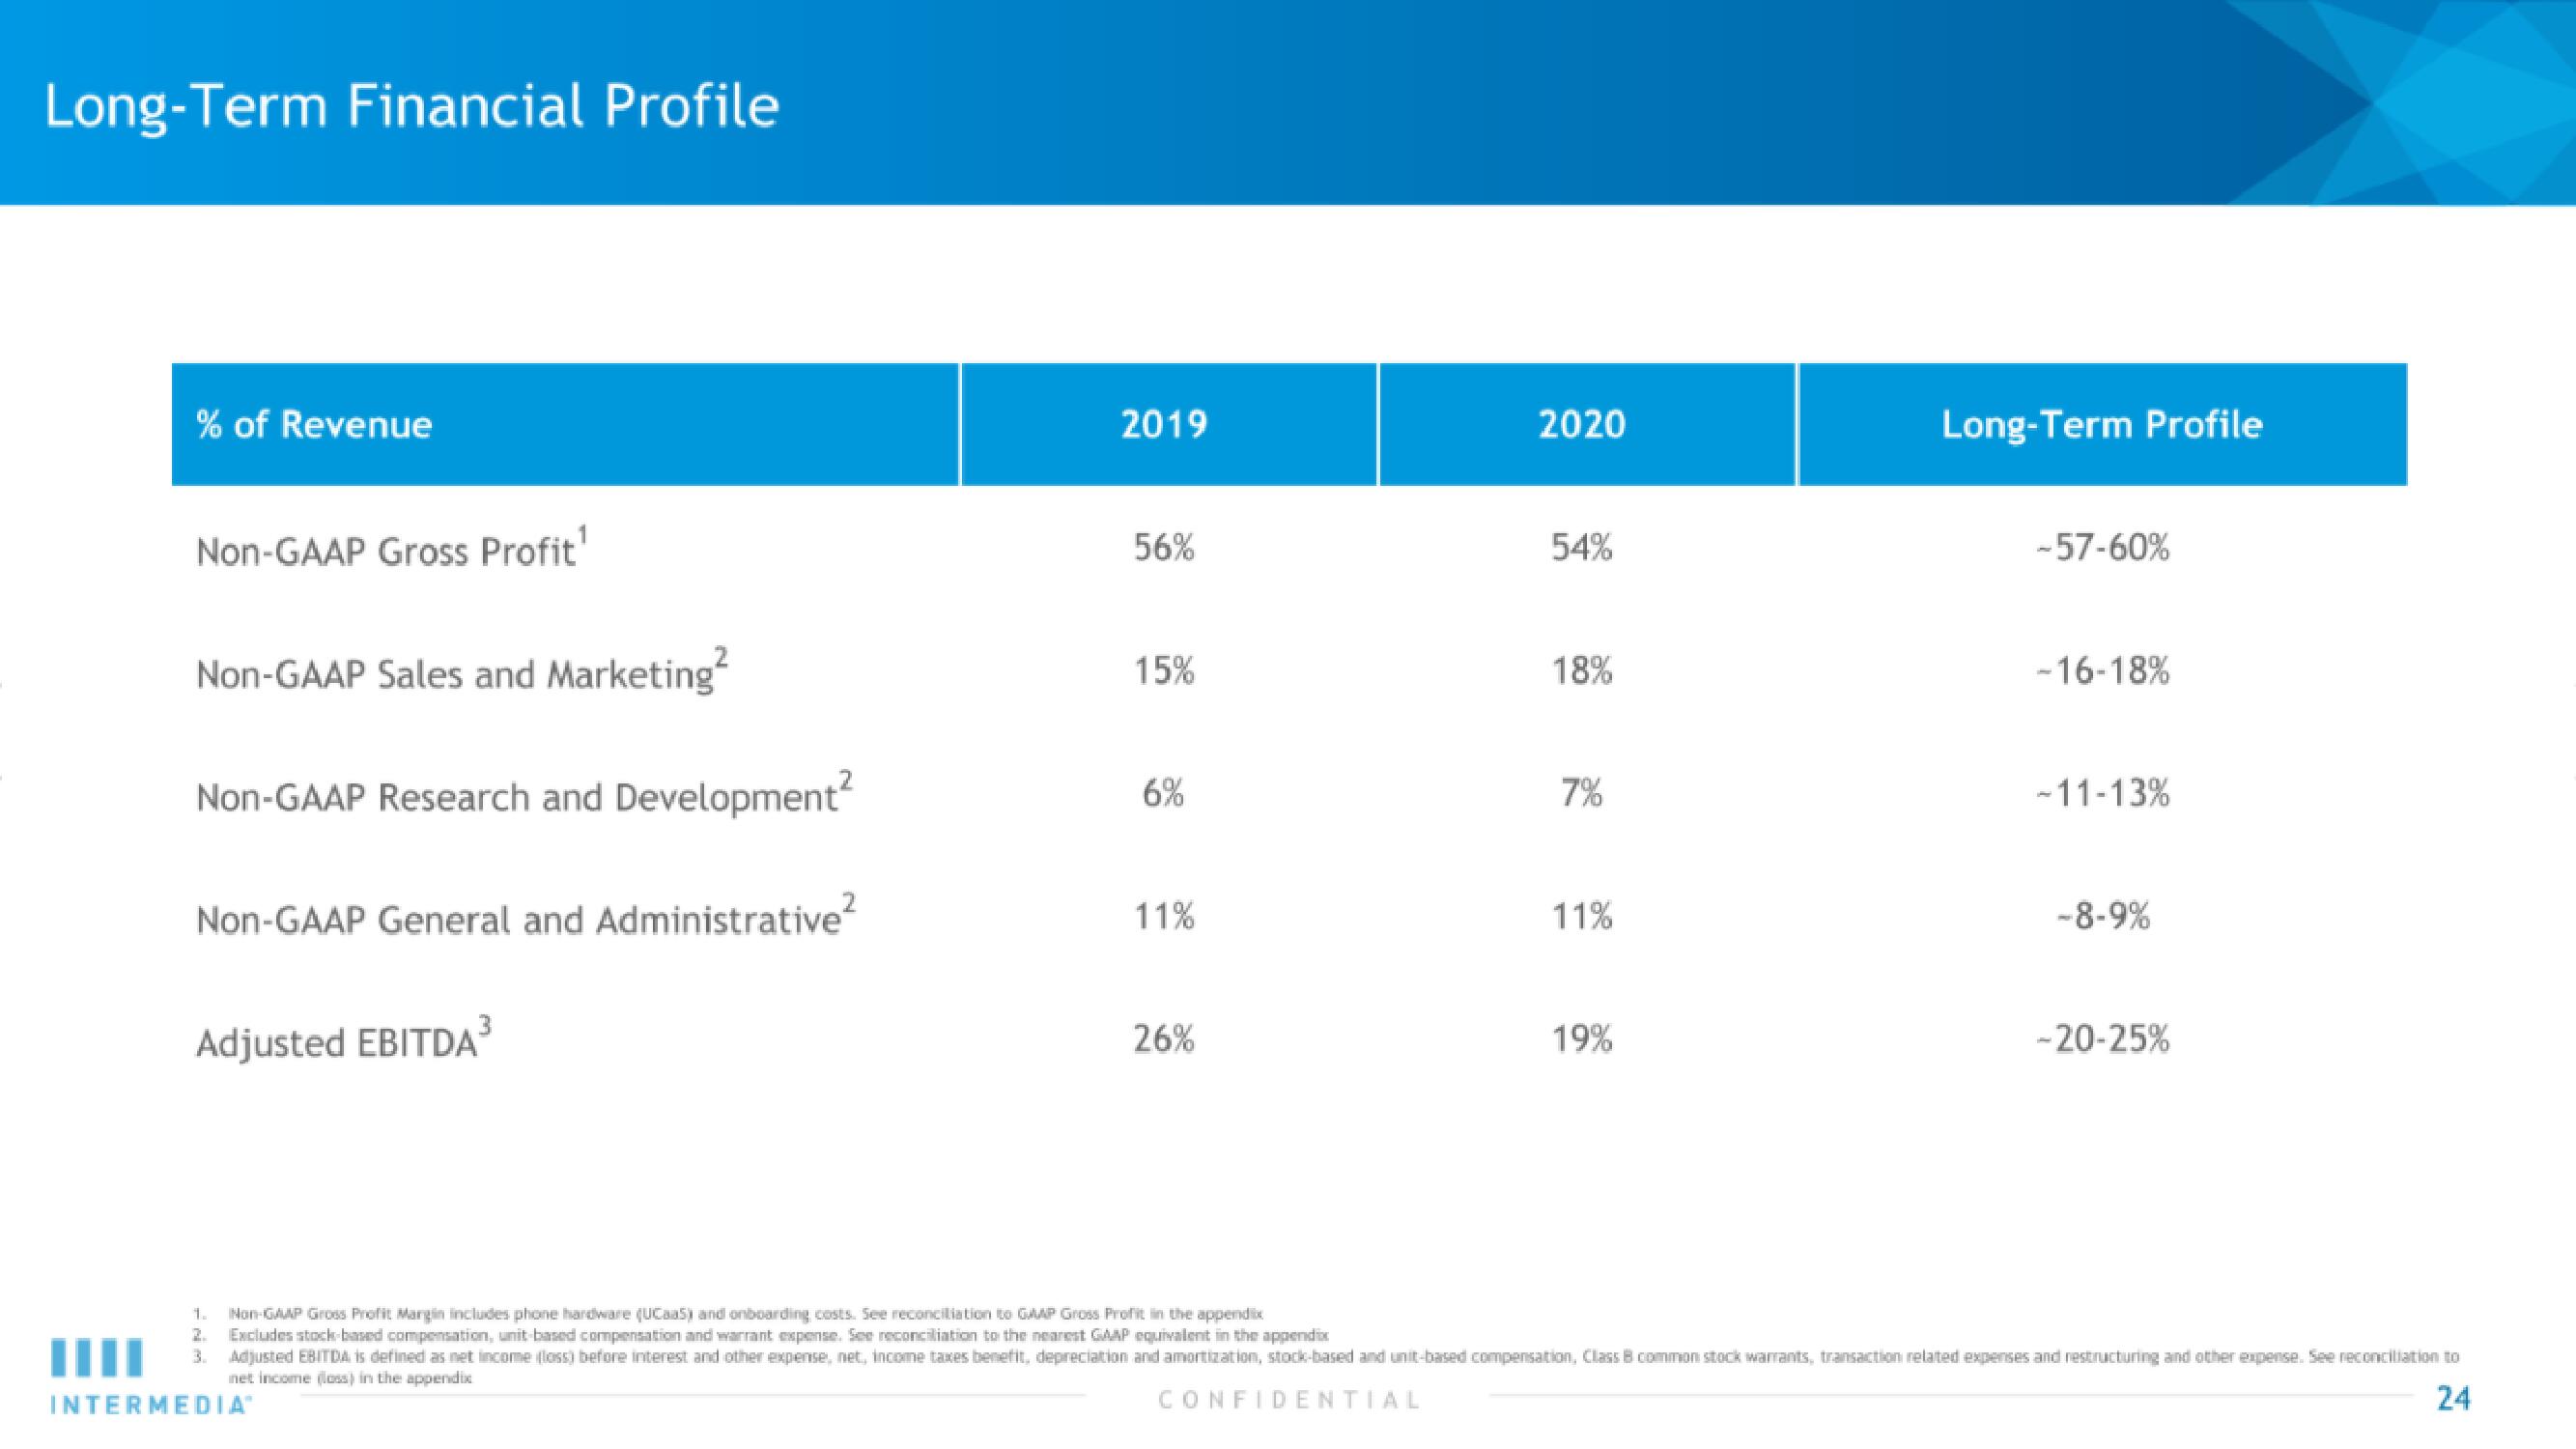
% of Revenue
Non-GAAP Gross Profit¹
Non-GAAP Sales and Marketing²
Non-GAAP Research and Development²
Non-GAAP General and Administrative²
Adjusted EBITDA³
2019
56%
INTERMEDIAⓇ
15%
6%
11%
26%
1.
Non-GAMP Gross Profit Margin includes phone hardware (UCaaS) and onboarding costs. See reconciliation to GAAP Gross Profit in the appendix
2. Excludes stock-based compensation, unit-based compensation and warrant expense. See reconciliation to the nearest GAAP equivalent in the appendix
2020
54%
18%
7%
11%
19%
Long-Term Profile
-57-60%
-16-18%
-11-13%
-8-9%
-20-25%
Adjusted EBITDA is defined as net income (loss) before interest and other expense, net, income taxes benefit, depreciation and amortization, stock-based and unit-based compensation, Class B common stock warrants, transaction related expenses and restructuring and other expense. See reconciliation to
net income (loss) in the appendix
CONFIDENTIAL
24View entire presentation