Nuvei Results Presentation Deck
25
Statements of Profit or Loss
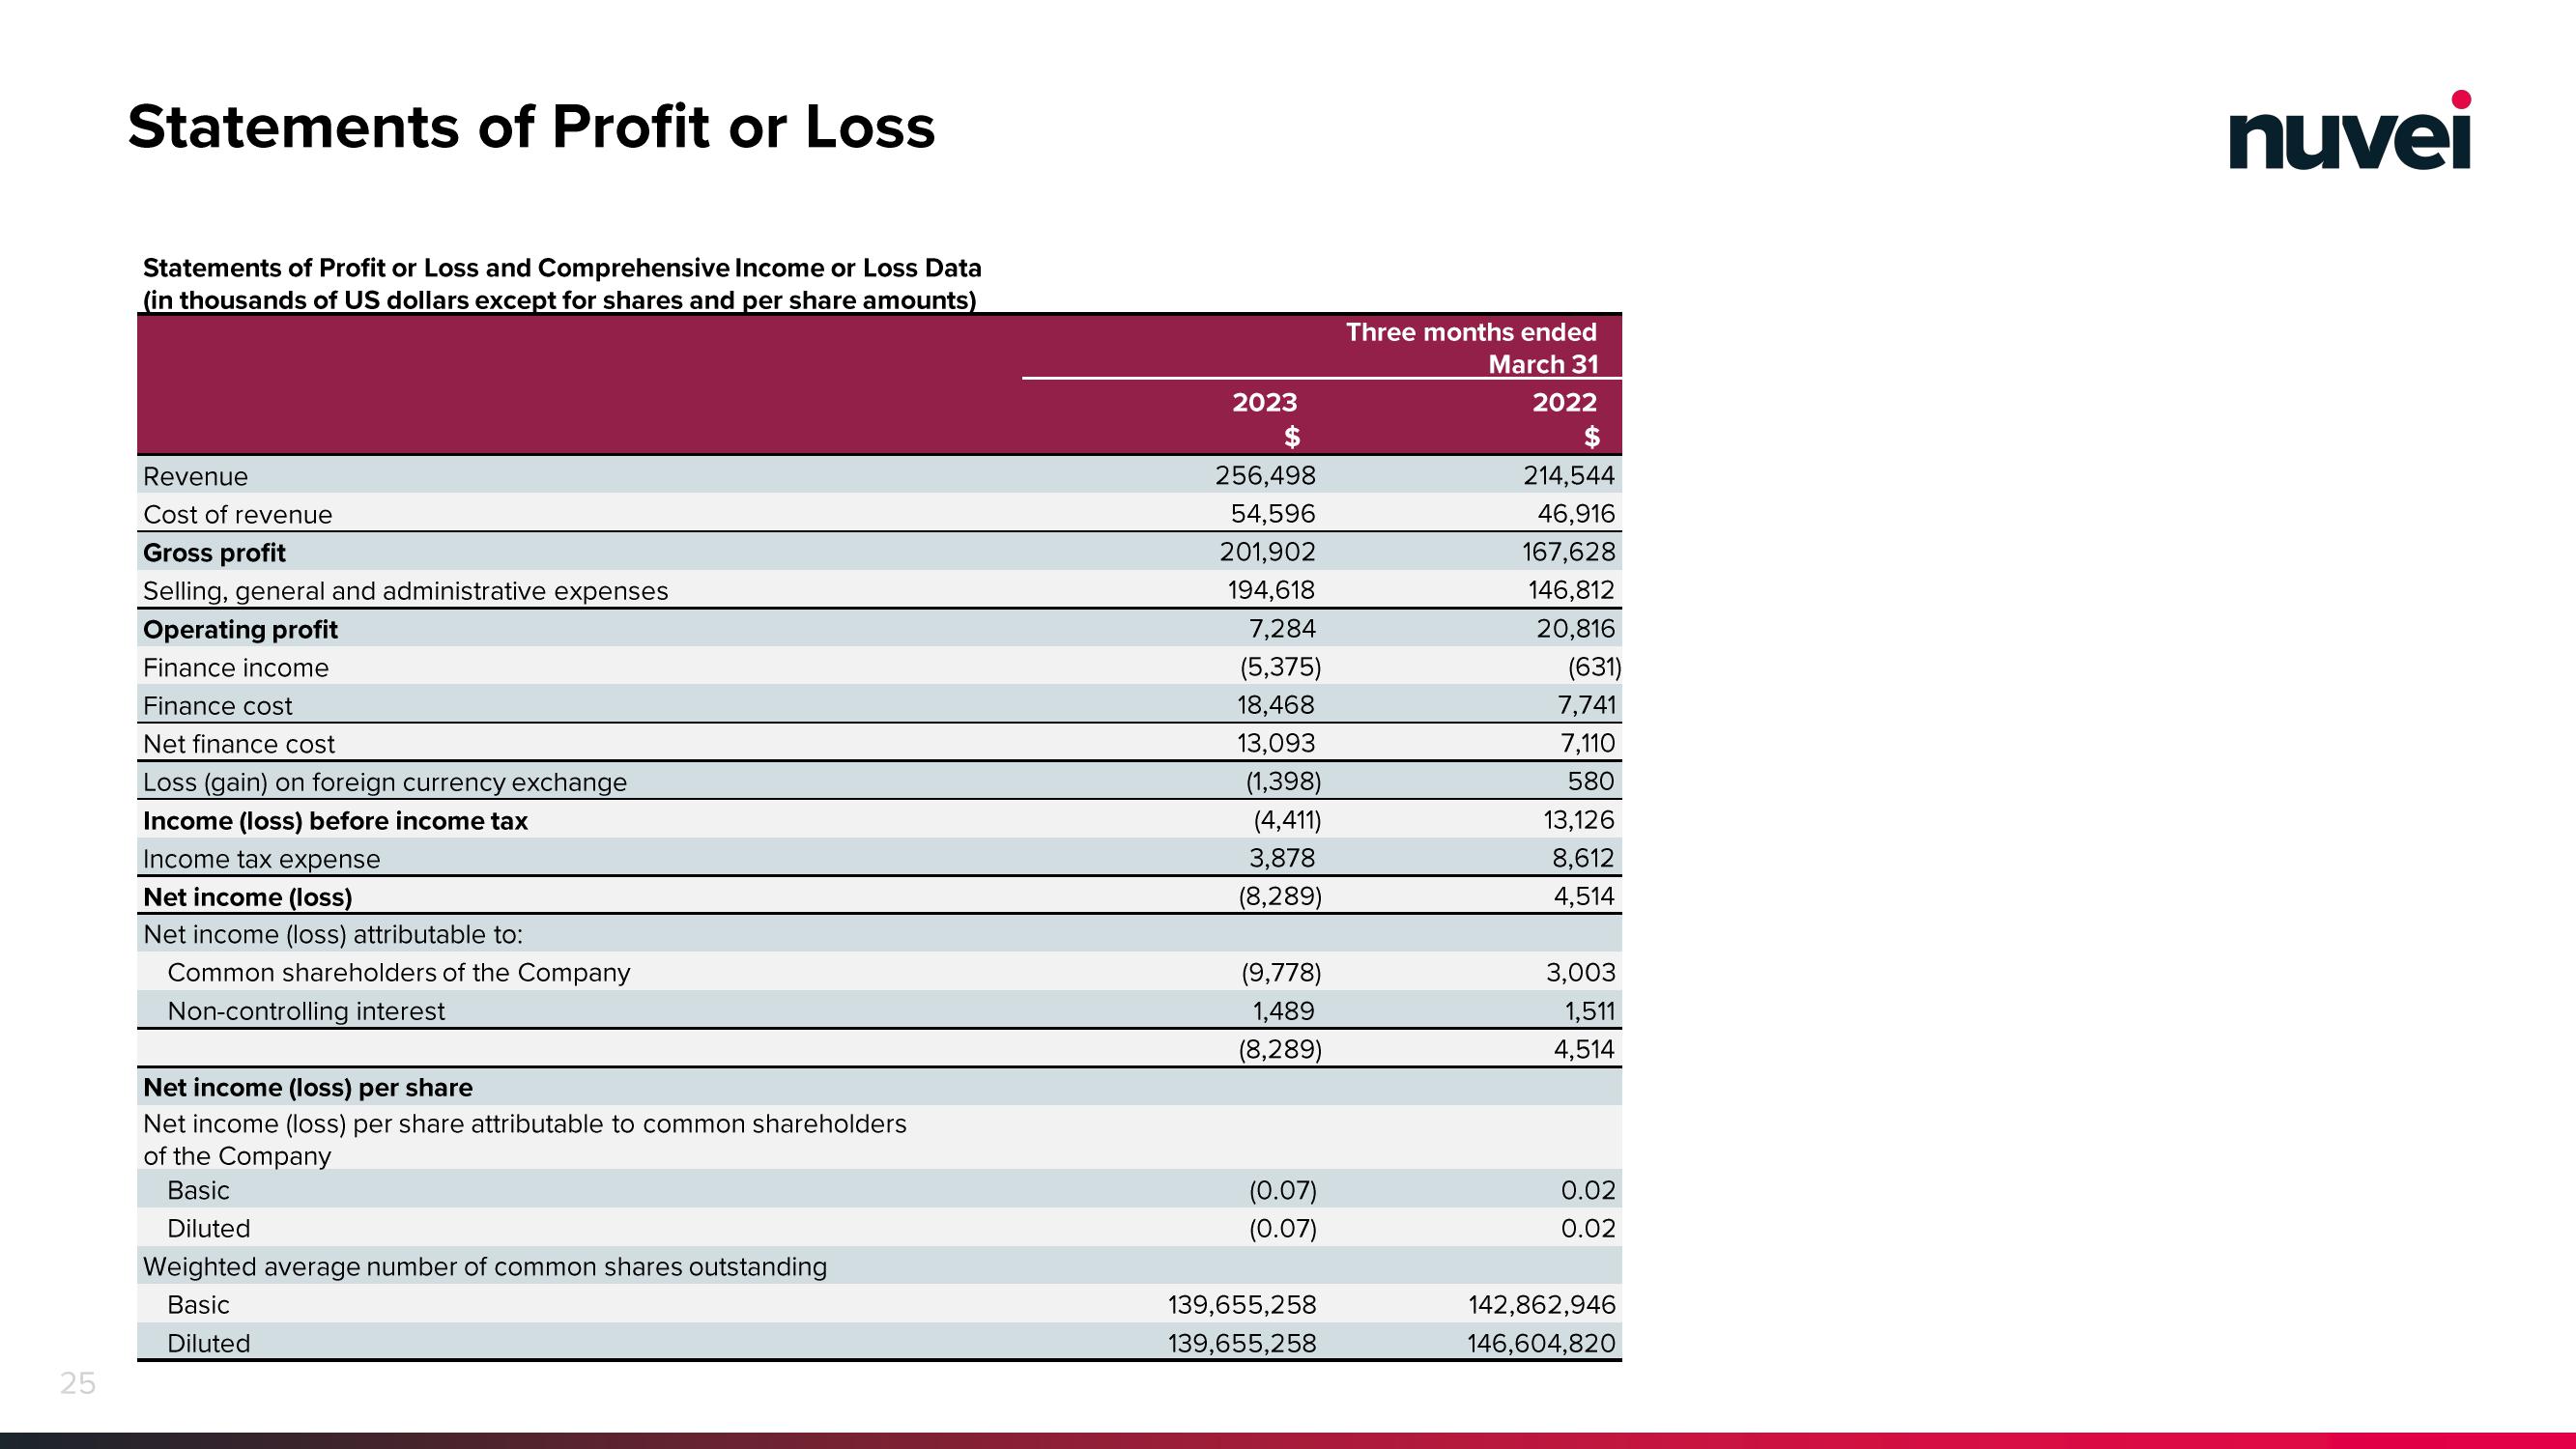
Statements of Profit or Loss and Comprehensive Income or Loss Data
(in thousands of US dollars except for shares and per share amounts)
Revenue
Cost of revenue
Gross profit
Selling, general and administrative expenses
Operating profit
Finance income
Finance cost
Net finance cost
Loss (gain) on foreign currency exchange
Income (loss) before income tax
Income tax expense
Net income (loss)
Net income (loss) attributable to:
Common shareholders of the Company
Non-controlling interest
Net income (loss) per share
Net income (loss) per share attributable to common shareholders
of the Company
Basic
Diluted
Weighted average number of common shares outstanding
Basic
Diluted
2023
$
256,498
54,596
201,902
194,618
7,284
(5,375)
18,468
13,093
(1,398)
(4,411)
3,878
(8,289)
(9,778)
1,489
(8,289)
(0.07)
(0.07)
139,655,258
139,655,258
Three months ended
March 31
2022
$
214,544
46,916
167,628
146,812
20,816
(631)
7,741
7,110
580
13,126
8,612
4,514
3,003
1,511
4,514
0.02
0.02
142,862,946
146,604,820
nuveiView entire presentation