J.P.Morgan 4Q23 Earnings Results
JPMORGAN CHASE & CO.
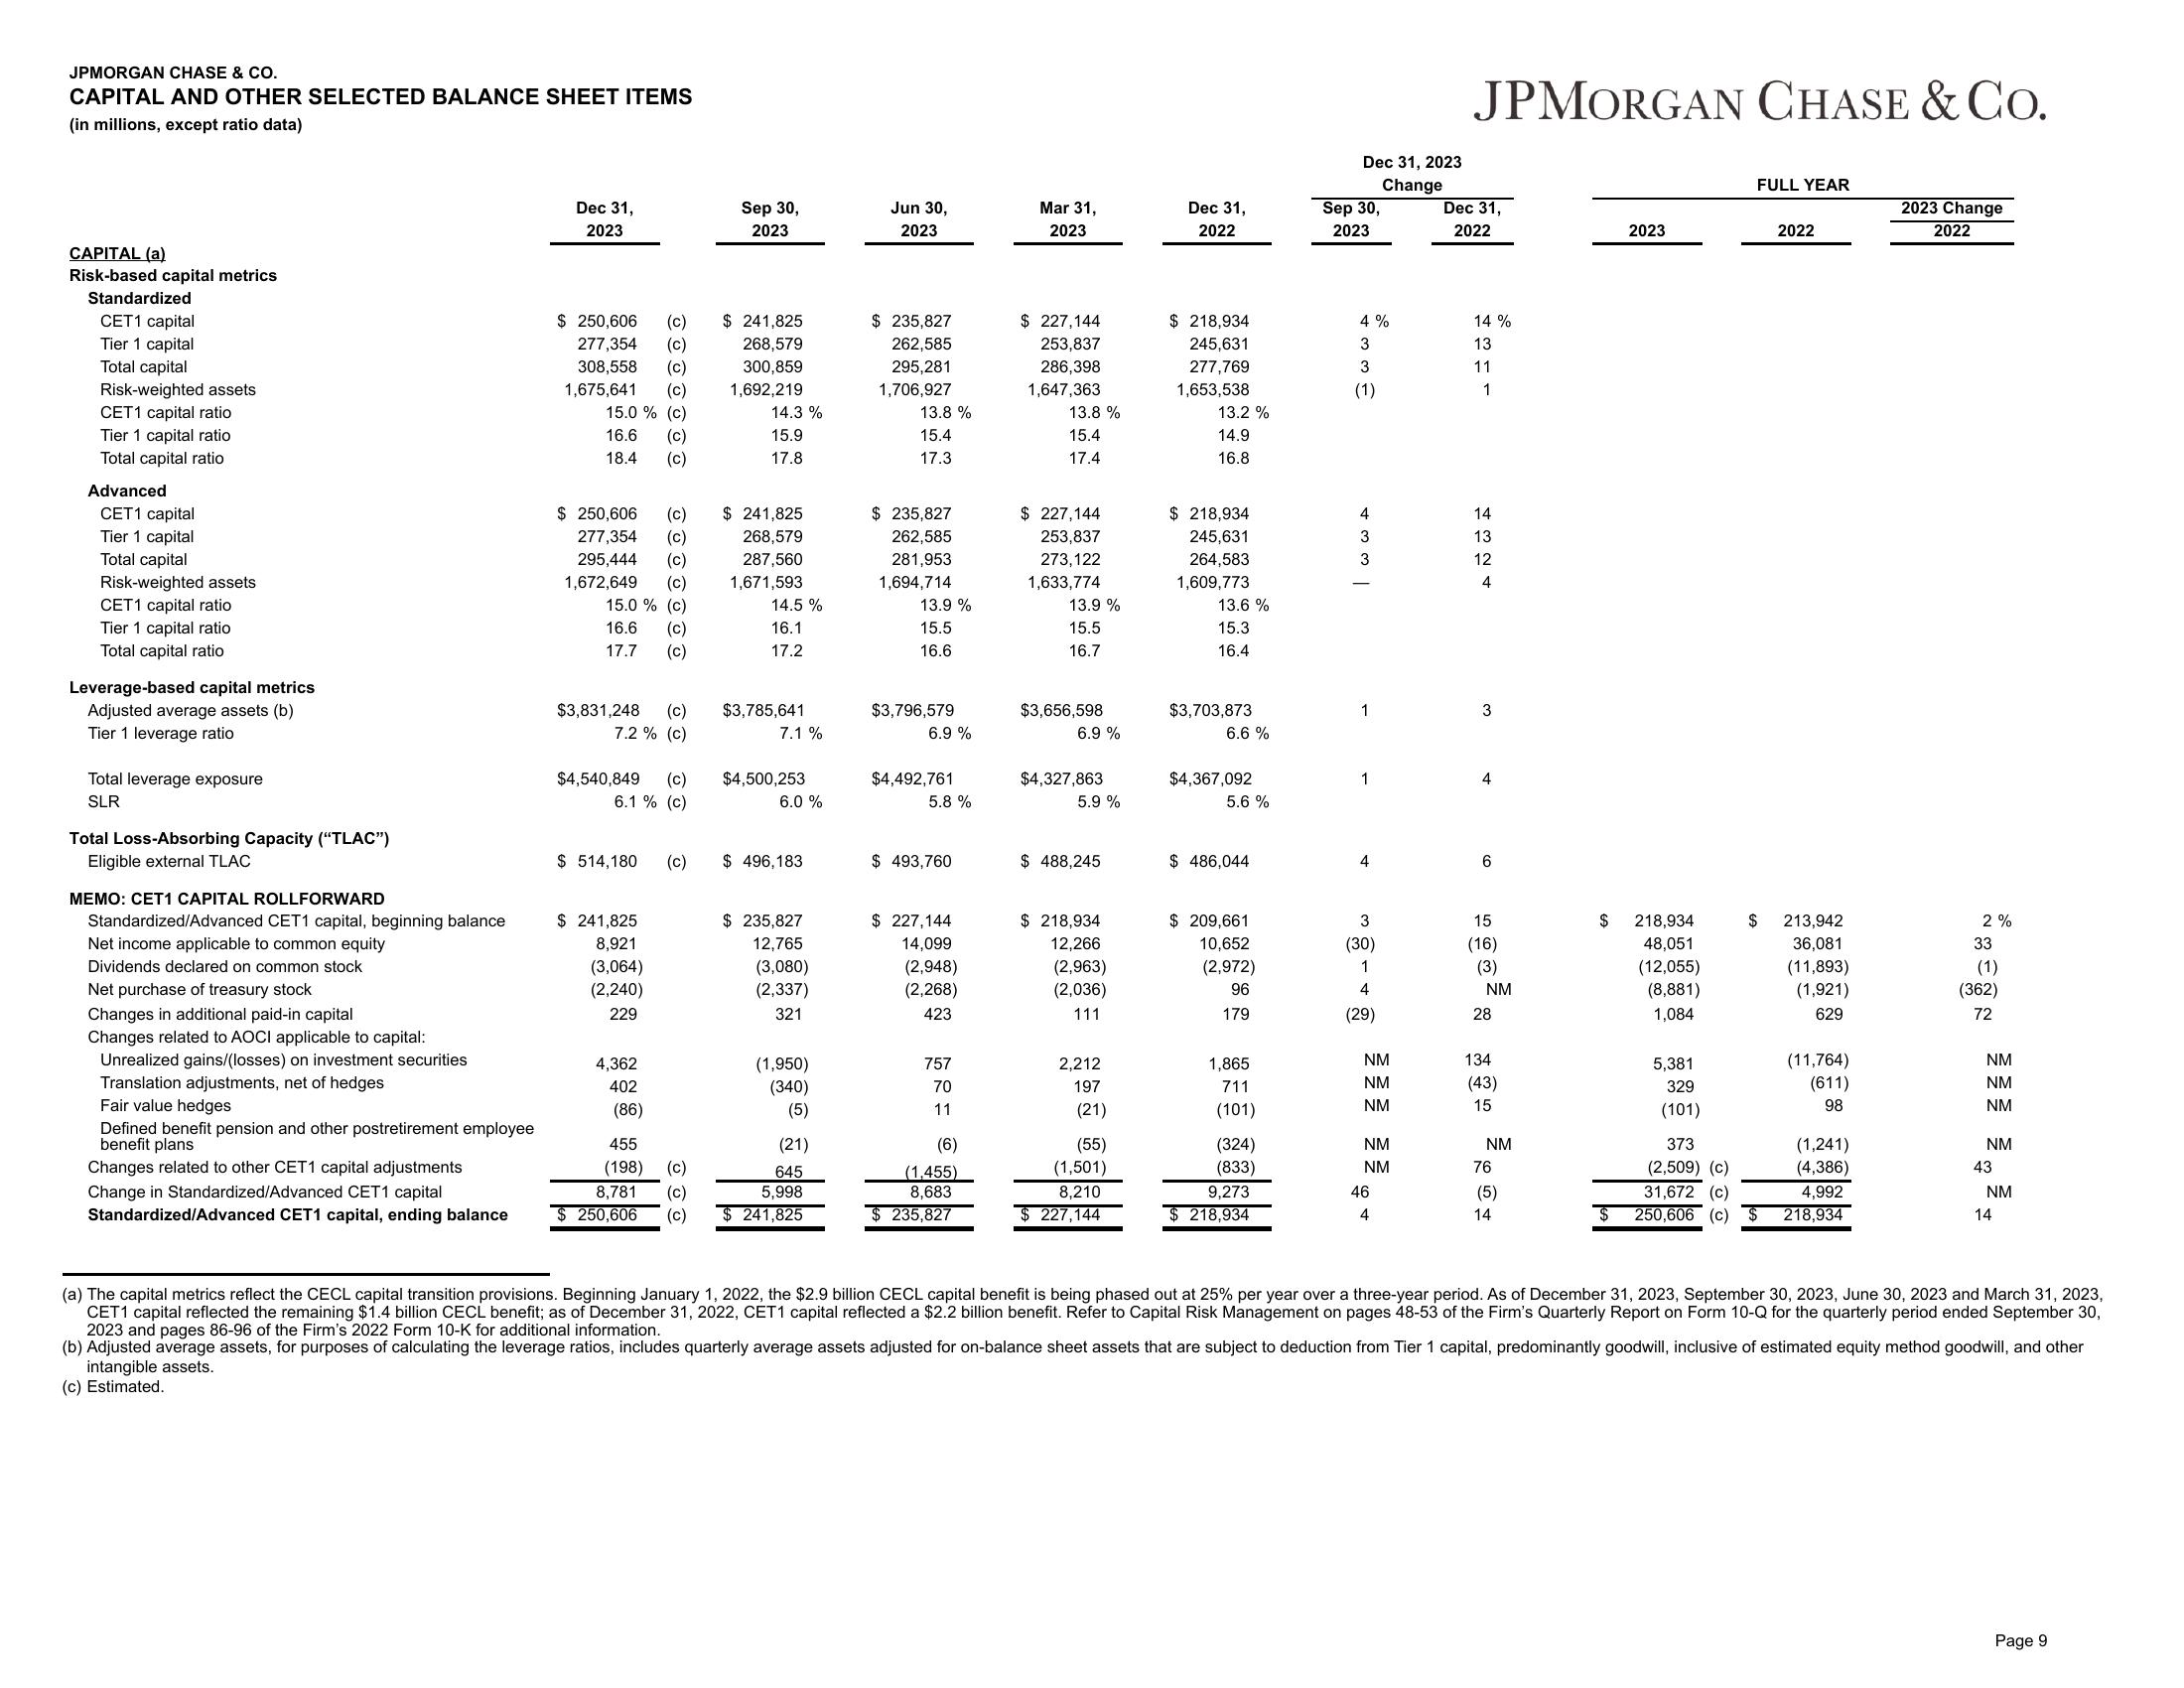
CAPITAL AND OTHER SELECTED BALANCE SHEET ITEMS
(in millions, except ratio data)
CAPITAL (a)
Risk-based capital metrics
Standardized
CET1 capital
Tier 1 capital
Total capital
Risk-weighted assets
CET1 capital ratio
Tier 1 capital ratio
Total capital ratio
Advanced
CET1 capital
Tier 1 capital
Total capital
Risk-weighted assets
CET1 capital ratio
Tier 1 capital ratio
Total capital ratio
Leverage-based capital metrics
Adjusted average assets (b)
Tier 1 leverage ratio
Total leverage exposure
SLR
Total Loss-Absorbing Capacity ("TLAC")
Eligible external TLAC
MEMO: CET1 CAPITAL ROLLFORWARD
Standardized/Advanced CET1 capital, beginning balance
Net income applicable to common equity
Dividends declared on common stock
Net purchase of treasury stock
Changes in additional paid-in capital
Changes related to AOCI applicable to capital:
Unrealized gains/(losses) on investment securities
Translation adjustments, net of hedges
Fair value hedges
Defined benefit pension and other postretirement employee
benefit plans
Changes related to other CET1 capital adjustments
Change in Standardized/Advanced CET1 capital
Standardized/Advanced CET1 capital, ending balance
Dec 31,
2023
$ 250,606
277,354
308,558
1,675,641
15.0 % (c)
16.6
18.4
$ 250,606 (c)
295,444
1,672,649
이이이이이이이
277,354 (c)
이이이이이이이
15.0 % (c)
16.6
17.7
$ 241,825
8,921
(3,064)
(2,240)
229
(c)
4,362
402
(c)
$4,540,849 (c)
6.1 % (c)
(86)
$ 514,180 (c)
$3,831,248 (c) $3,785,641
7.2% (c)
Sep 30,
2023
455
(198) (c)
8,781 (c)
250,606 (c)
$241,825
268,579
300,859
1,692,219
14.3%
15.9
17.8
$241,825
268,579
287,560
1,671,593
14.5%
16.1
17.2
7.1 %
$4,500,253
6.0 %
$ 496,183
$ 235,827
12,765
(3,080)
(2,337)
321
(1,950)
(340)
(5)
(21)
645
5,998
$241,825
Jun 30,
2023
$ 235,827
262,585
295,281
1,706,927
13.8%
15.4
17.3
$ 235,827
262,585
281,953
1,694,714
13.9%
15.5
16.6
$3,796,579
6.9 %
$4,492,761
5.8 %
$493,760
$ 227,144
14,099
(2,948)
(2,268)
423
757
70
11
(6)
(1,455)
8,683
235,827
Mar 31,
2023
$ 227,144
253,837
286,398
1,647,363
13.8 %
15.4
17.4
$ 227,144
253,837
273, 122
1,633,774
13.9%
15.5
16.7
$3,656,598
6.9 %
$4,327,863
5.9 %
$ 488,245
$ 218,934
12,266
(2,963)
(2,036)
111
2,212
197
(21)
(55)
(1,501)
8,210
$227,144
Dec 31,
2022
$218,934
245,631
277,769
1,653,538
13.2 %
14.9
16.8
$218,934
245,631
264,583
1,609,773
13.6 %
15.3
16.4
$3,703,873
6.6 %
$4,367,092
5.6 %
$ 486,044
$ 209,661
10,652
(2,972)
96
179
1,865
711
(101)
(324)
(833)
9,273
$218,934
Dec 31, 2023
Change
Sep 30,
2023
4%
3
3
(1)
4
3
3
1
1
4
3
(30)
1
4
(29)
NM
NM
NM
NM
NM
46
4
JPMORGAN CHASE & Co.
Dec 31,
2022
14 %
13
11
1
14
13
12
4
3
4
6
15
(16)
(3)
NM
28
134
(43)
15
NM
76
(5)
14
$
$
2023
218,934
48,051
(12,055)
(8,881)
1,084
5,381
329
(101)
FULL YEAR
2022
$ 213,942
36,081
(11,893)
(1,921)
629
373
(2,509) (c)
31,672 (c)
250,606 (c) $
(11,764)
(611)
98
(1,241)
(4,386)
4,992
218,934
2023 Change
2022
*æēgs 11³ 1,1,
(362)
(a) The capital metrics reflect the CECL capital transition provisions. Beginning January 1, 2022, the $2.9 billion CECL capital benefit is being phased out at 25% per year over a three-year period. As of December 31, 2023, September 30, 2023, June 30, 2023 and March 31, 2023,
CET1 capital reflected the remaining $1.4 billion CECL benefit; as of December 31, 2022, CET1 capital reflected a $2.2 billion benefit. Refer to Capital Risk Management on pages 48-53 of the Firm's Quarterly Report on Form 10-Q for the quarterly period ended September 30,
2023 and pages 86-96 of the Firm's 2022 Form 10-K for additional information.
(b) Adjusted average assets, for purposes of calculating the leverage ratios, includes quarterly average assets adjusted for on-balance sheet assets that are subject to deduction from Tier 1 capital, predominantly goodwill, inclusive of estimated equity method goodwill, and other
intangible assets.
(c) Estimated.
Page 9View entire presentation