Allwyn Investor Conference Presentation Deck
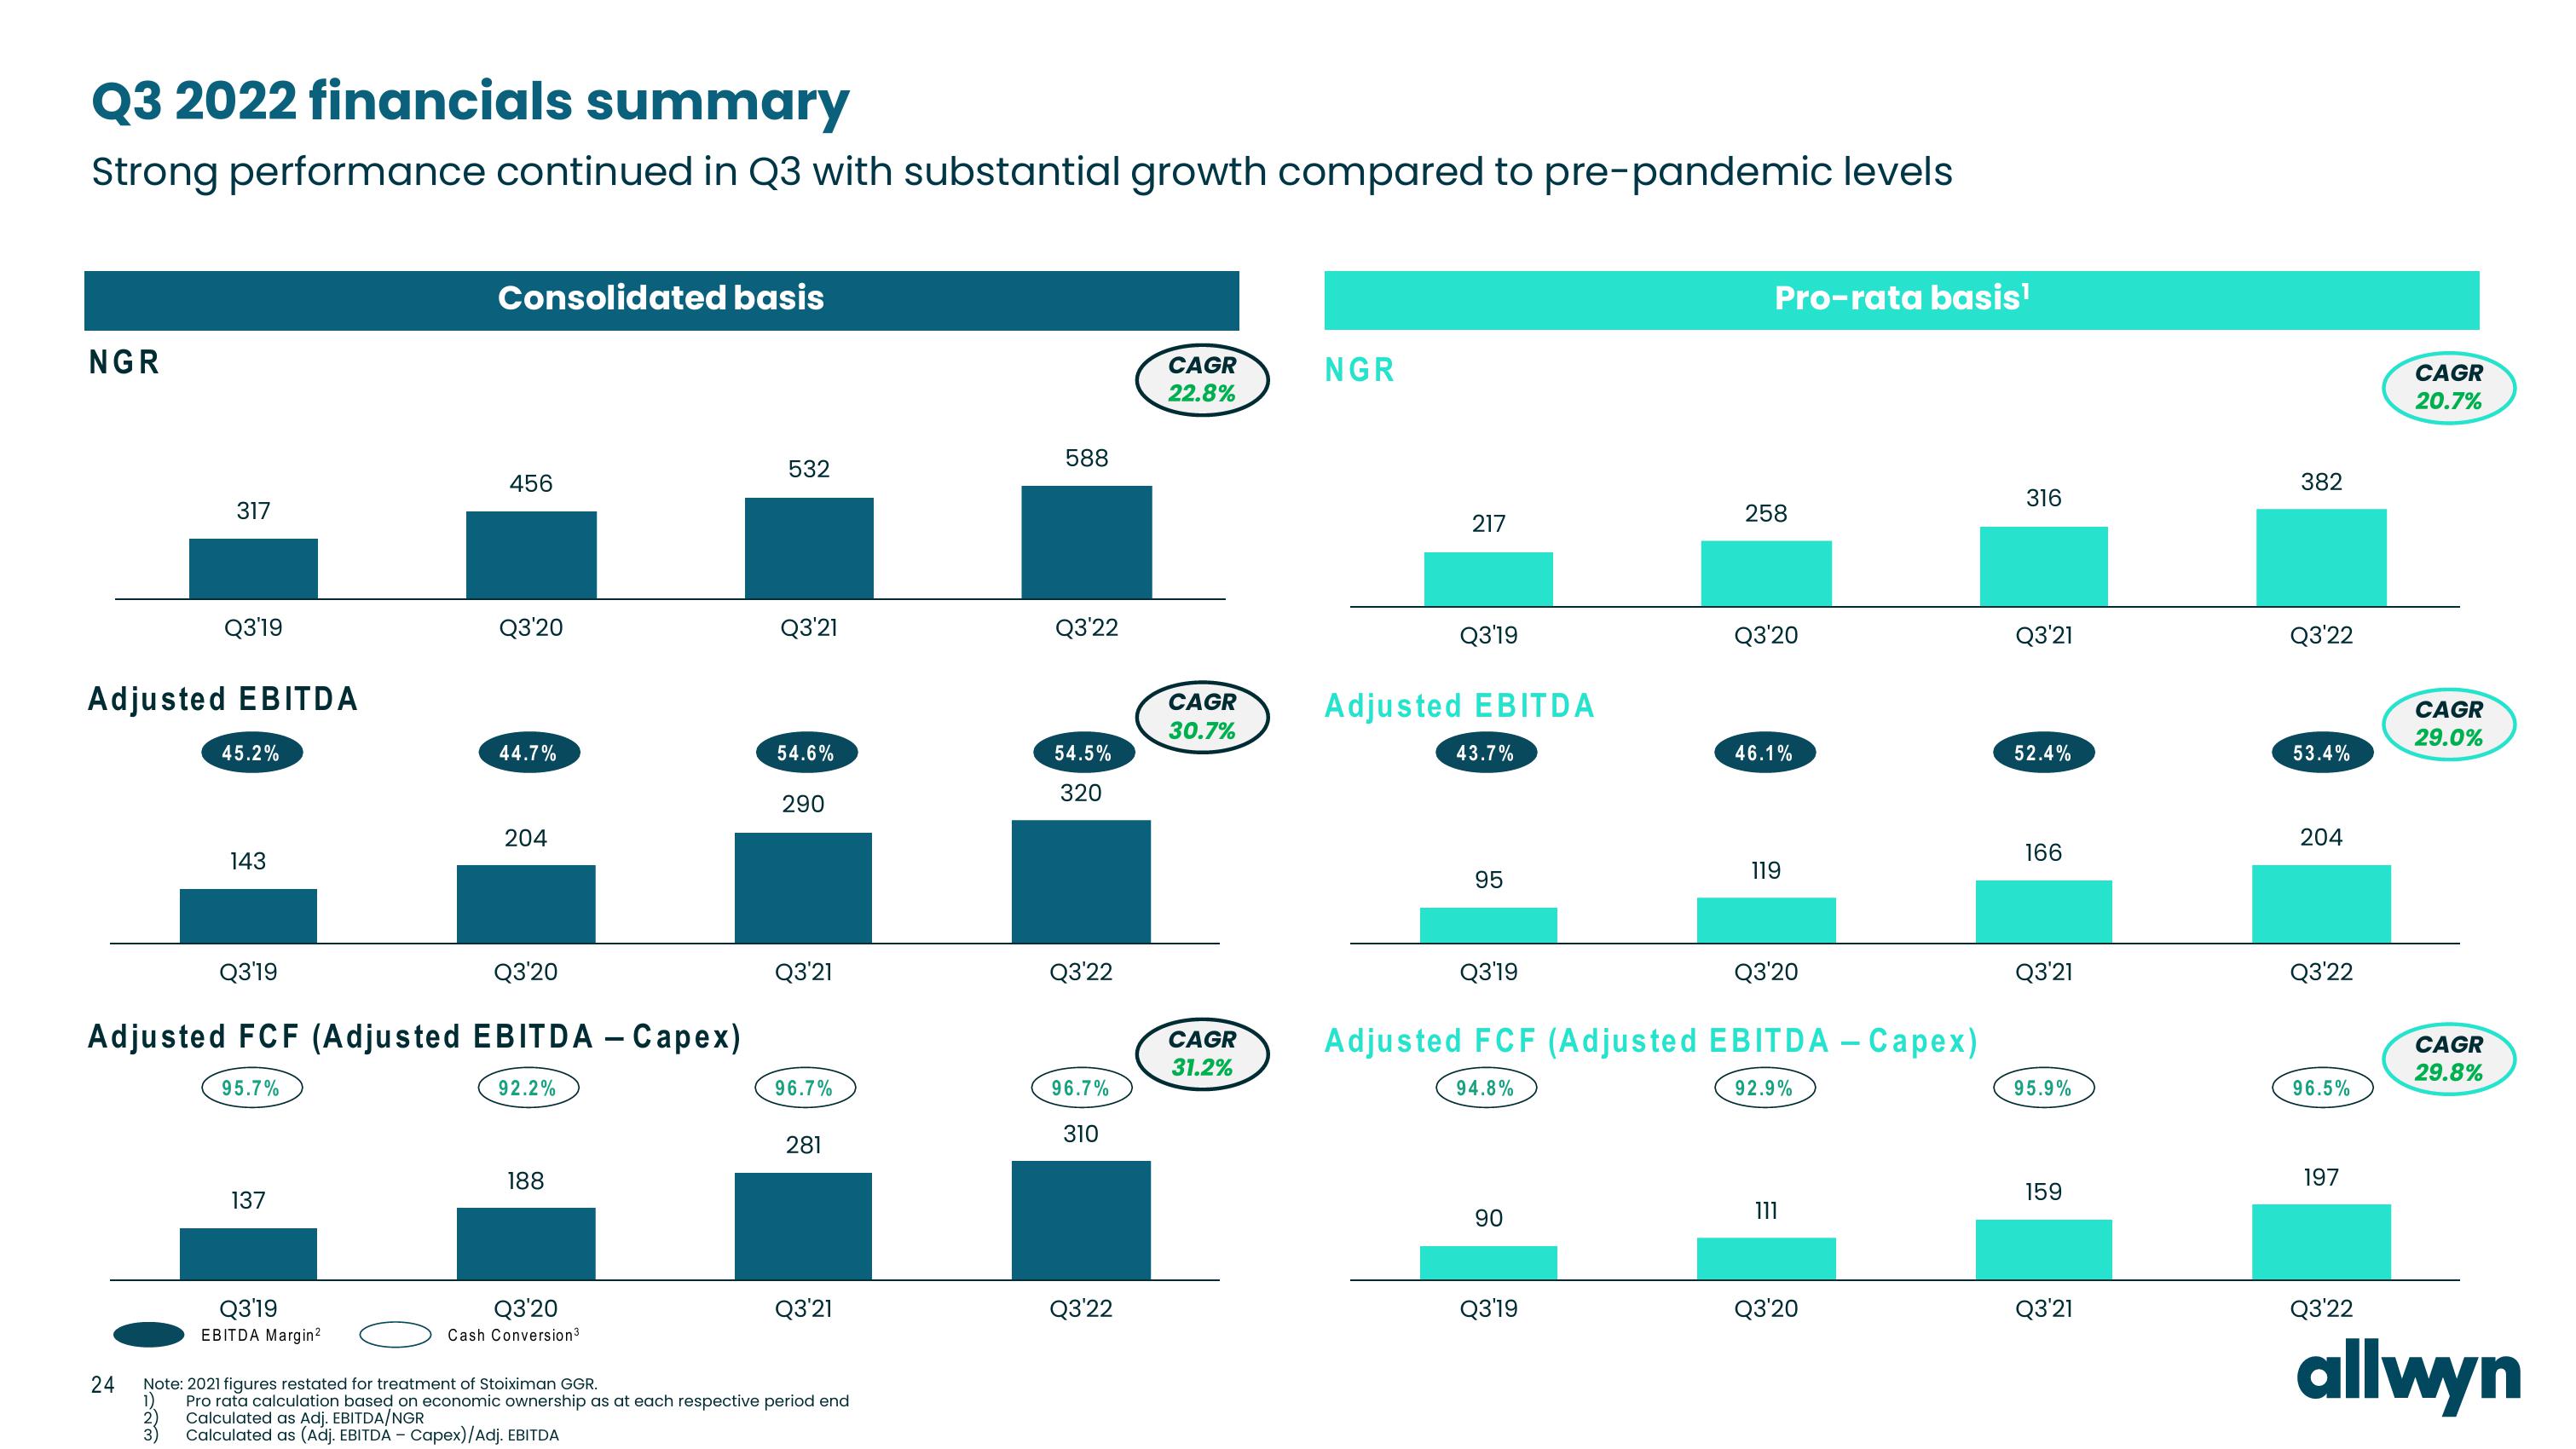
Q3 2022 financials summary
Strong performance continued in Q3 with substantial growth compared to pre-pandemic levels
NGR
317
Adjusted EBITDA
24
Q3'19
1)
2)
3)
45.2%
143
95.7%
137
Consolidated basis
Q3'19
Q3'20
Adjusted FCF (Adjusted EBITDA - Capex)
92.2%
Q3'19
EBITDA Margin²
456
Q3'20
44.7%
204
188
Q3'20
Cash Conversion ³
532
Q3'21
54.6%
290
Q3'21
96.7%
281
Q3'21
Note: 2021 figures restated for treatment of Stoiximan GGR.
Pro rata calculation based on economic ownership as at each respective period end
Calculated as Adj. EBITDA/NGR
Calculated as (Adj. EBITDA - Capex)/Adj. EBITDA
588
Q3'22
54.5%
320
Q3'22
96.7%
310
Q3'22
CAGR
22.8%
CAGR
30.7%
CAGR
31.2%
NGR
217
Q3'19
Adjusted EBITDA
43.7%
95
Q3'19
90
Pro-rata basis¹
Q3'19
258
Q3'20
46.1%
119
Adjusted FCF (Adjusted EBITDA - Capex)
94.8%
92.9%
Q3'20
111
Q3'20
316
Q3'21
52.4%
166
Q3'21
95.9%
159
Q3'21
382
Q3'22
53.4%
204
Q3'22
96.5%
197
Q3'22
CAGR
20.7%
CAGR
29.0%
CAGR
29.8%
allwynView entire presentation