Sonos Results Presentation Deck
Revenue and Adjusted EBITDA Near High-end of Guide
Q4 Revenue
$339.8
CC: +14%
Reported: +16%
4Q20
Americas (59% of sales): +27% y/y
EMEA (34% of sales): +16% y/y
APAC (7% of sales): -34% y/y
Q4 Adjusted EBITDA
$46.4
13.7% margin
4Q20
$359.5
CC: +4%
Reported: +6%
4Q21
Americas (55% of sales): -2% y/y
EMEA (38% of sales): +18% y/y
APAC (7% of sales): +10% y/y
$17.1
4.8% margin
4Q21
CC: -7%
Reported: -12%
$316.3
4Q22
Americas (63% of sales): +2% y/y
EMEA (29% of sales): -34% y/y
APAC (8% of sales): -2% y/y
-$25.6
-8.1% margin
4Q22
Note: $ in millions (unless noted), unaudited. Adjusted EBITDA is a non-GAAP measure. See appendix for reconciliation of GAAP to non-GAAP measures.
Percentages have been calculated using actual, non-rounded figures and, therefore, may not recalculate precisely.
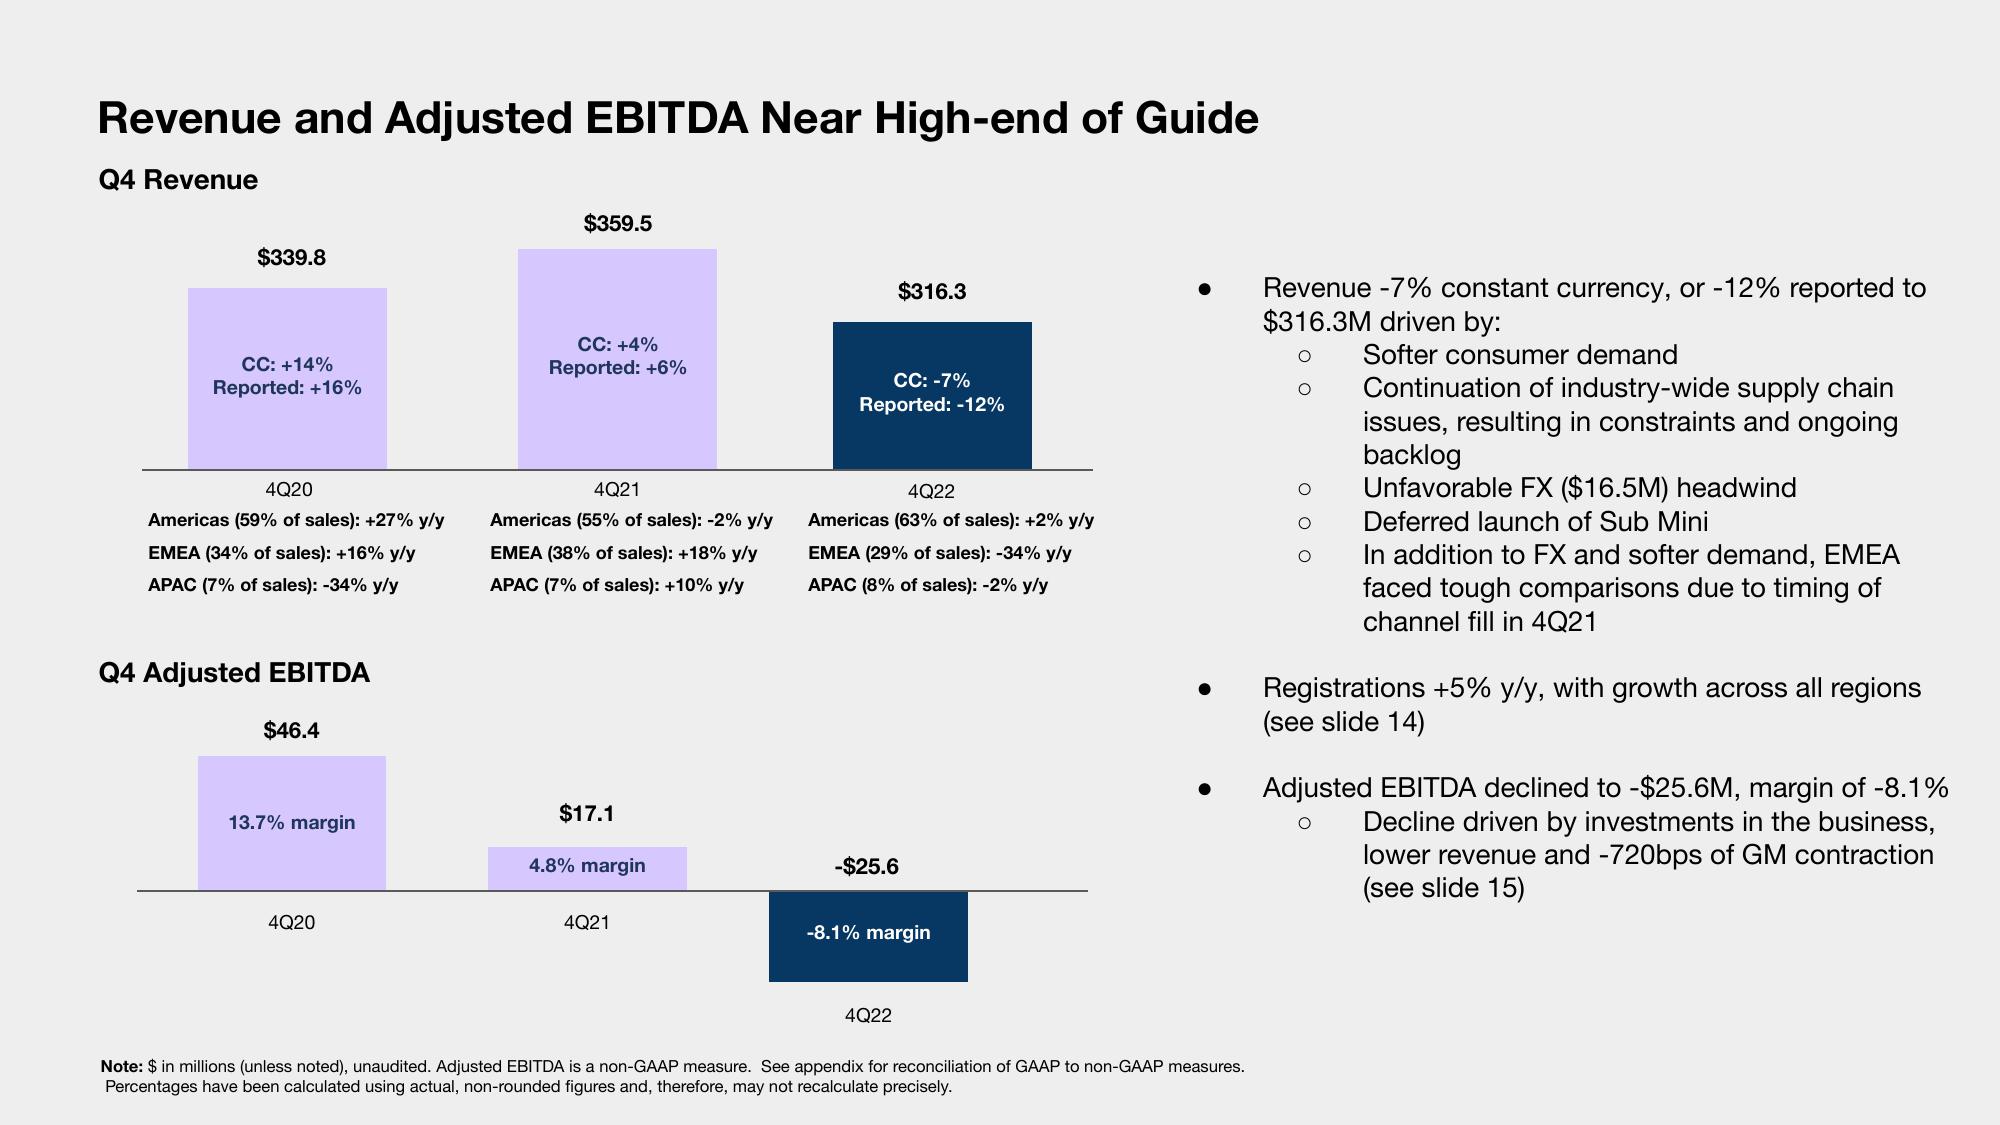
Revenue -7% constant currency, or -12% reported to
$316.3M driven by:
O
Softer consumer demand
O
OOO
Continuation of industry-wide supply chain
issues, resulting in constraints and ongoing
backlog
Unfavorable FX ($16.5M) headwind
Deferred launch of Sub Mini
In addition to FX and softer demand, EMEA
faced tough comparisons due to timing of
channel fill in 4Q21
Registrations +5% y/y, with growth across all regions
(see slide 14)
Adjusted EBITDA declined to -$25.6M, margin of -8.1%
Decline driven by investments in the business,
O
lower revenue and -720bps of GM contraction
(see slide 15)View entire presentation