Crocs Investor Presentation Deck slide image

Crocs Investor Presentation Deck

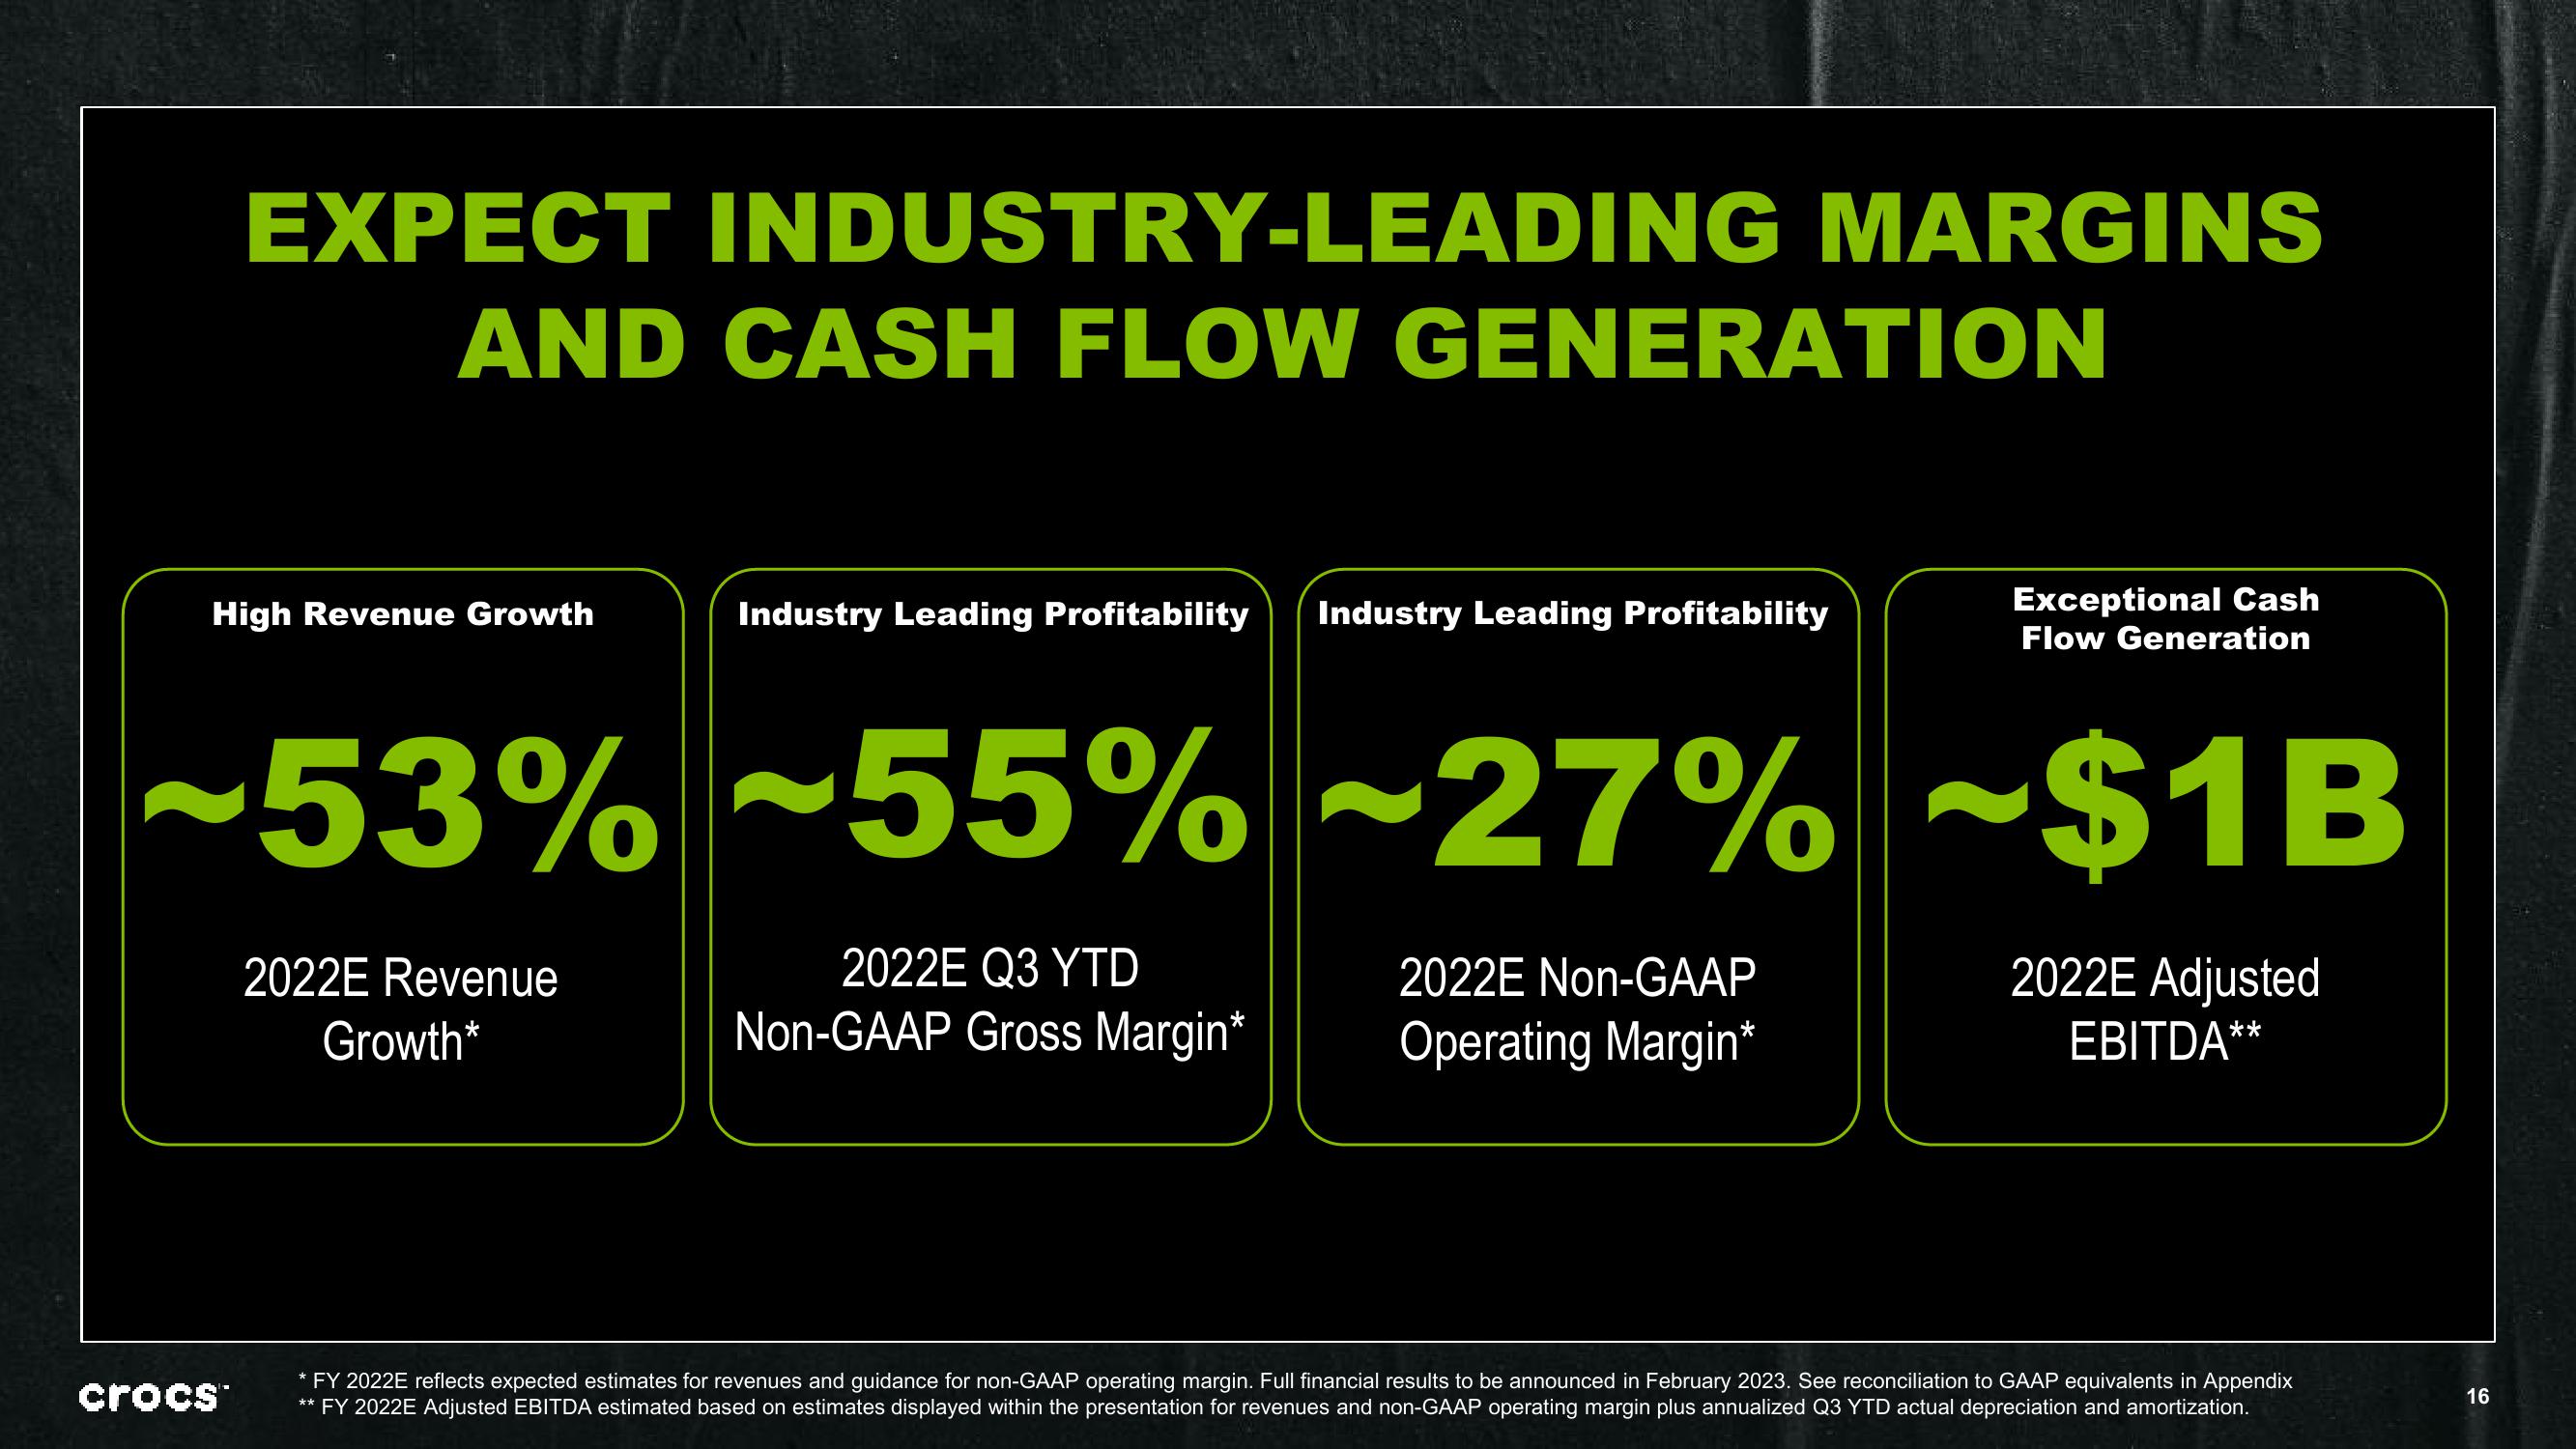
EXPECT INDUSTRY-LEADING MARGINS AND CASH FLOW GENERATION Exceptional Cash Flow Generation ~53% ~55% -27% ~$1B 2022E Q3 YTD Non-GAAP Gross Margin* High Revenue Growth crocs™ 2022E Revenue Growth* Industry Leading Profitability Industry Leading Profitability 2022E Non-GAAP Operating Margin* 2022E Adjusted EBITDA** * FY 2022E reflects expected estimates for revenues and guidance for non-GAAP operating margin. Full financial results to be announced in February 2023. See reconciliation to GAAP equivalents in Appendix ** FY 2022E Adjusted EBITDA estimated based on estimates displayed within the presentation for revenues and non-GAAP operating margin plus annualized Q3 YTD actual depreciation and amortization. 16
View entire presentation