Kinnevik Results Presentation Deck
Intro
SEKM
NET ASSET VALUE
LEGACY ASSETS, FINANCIAL POSITION & TOTALITY
Tele2
Zalando
Total Portfolio Value
Gross Cash
Gross Debt
Net Cash / (Debt)
Other Net Assets/(Liabilities)
Total Net Asset Value
Net Asset Value Per Share, SEK
Closing Price, Class B Share, SEK
Growth Portfolio
18.6
Net Invested
Cash
Net Asset Value
KINNEVIK
SEKbn
36.9
Fair Value
2022 Q1
Vintage
Interim Report Q1 2022
1993
2010
Portfolio Overview
Tele2
42%
Ownership
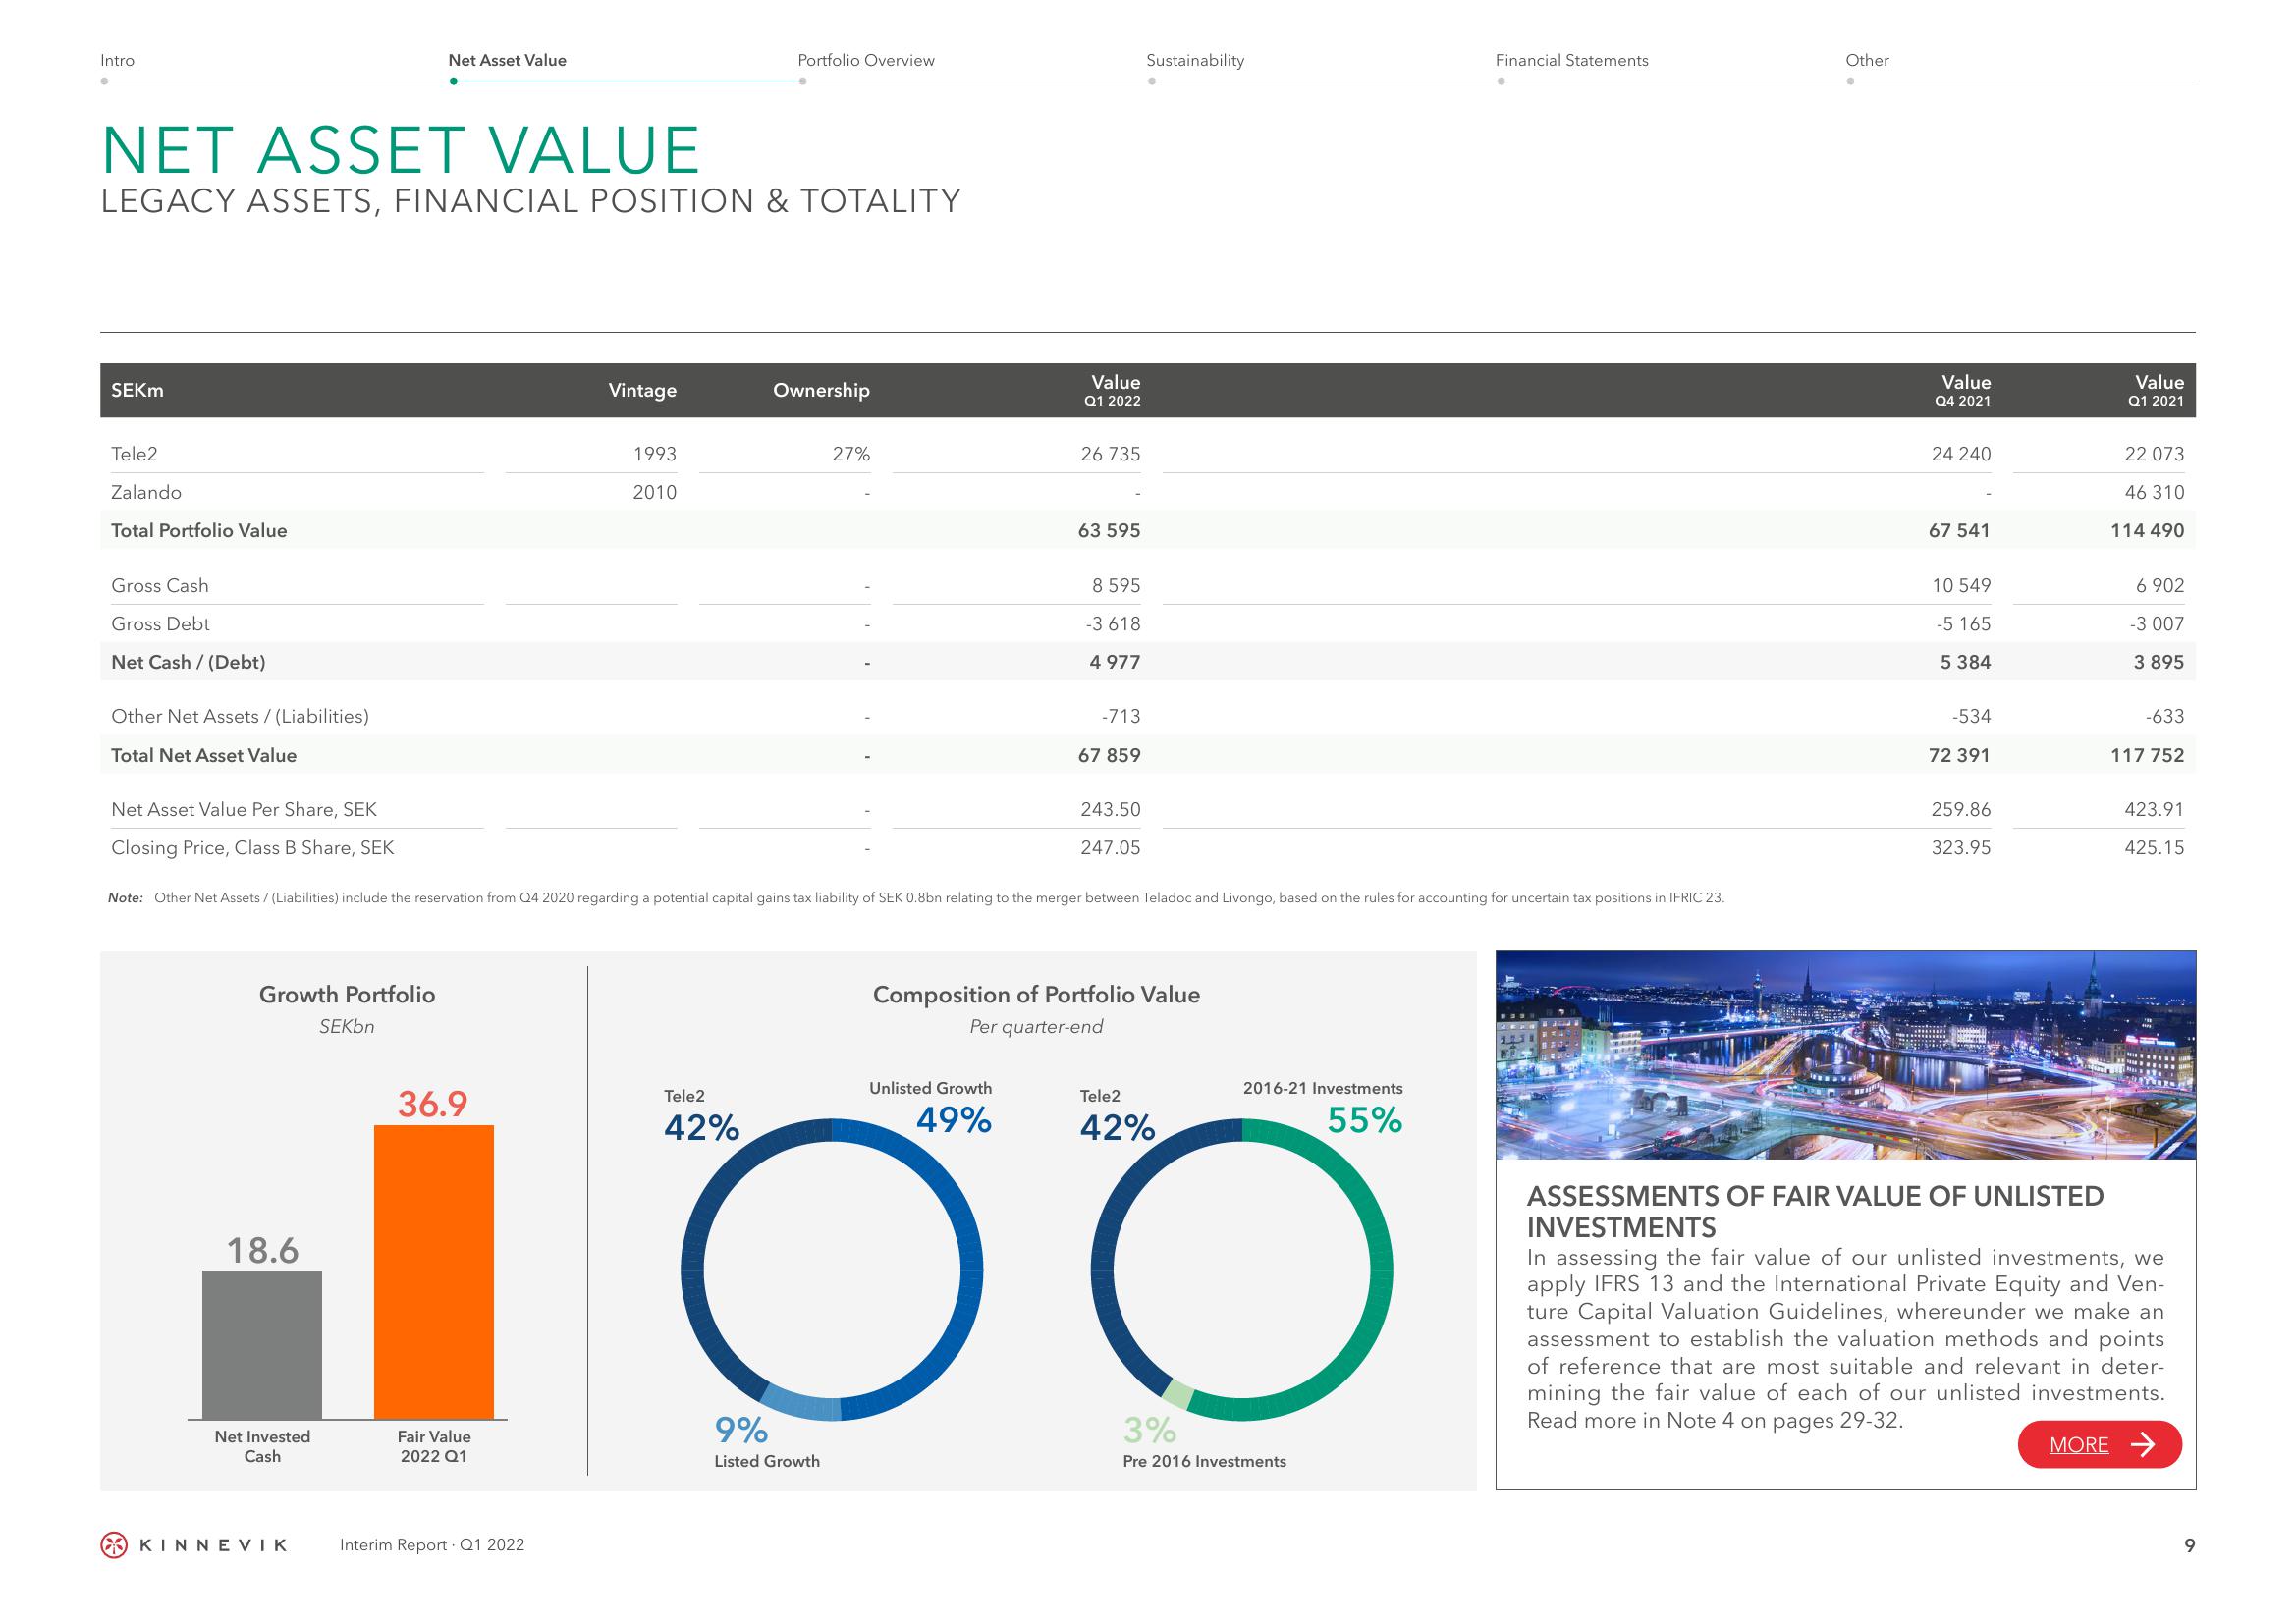
Note: Other Net Assets/ (Liabilities) include the reservation from Q4 2020 regarding a potential capital gains tax liability of SEK 0.8bn relating to the merger between Teladoc and Livongo, based on the rules for accounting for uncertain tax positions in IFRIC 23.
Value
Q1 2022
9%
Listed Growth
26 735
63 595
8 595
-3 618
4 977
-713
67 859
243.50
247.05
Sustainability
Composition of Portfolio Value
Per quarter-end
Unlisted Growth
2016-21 Investments
49%
55%
) 5
Tele2
42%
Financial Statements
3%
Pre 2016 Investments
Other
Value
Q4 2021
24 240
67 541
10
549
-5
165
5 384
-534
72 391
259.86
323.95
ASSESSMENTS OF FAIR VALUE OF UNLISTED
INVESTMENTS
Value
Q1 2021
22 0
46 310
114 490
6 902
-3 007
3 895
-633
117 752
423.91
425.15
In assessing the fair value of our unlisted investments, we
apply IFRS 13 and the International Private Equity and Ven-
ture Capital Valuation Guidelines, whereunder we make an
assessment to establish the valuation methods and points
of reference that are most suitable and relevant in deter-
mining the fair value of each of our unlisted investments.
Read more in Note 4 on pages 29-32.
MORE →
9View entire presentation