BAT Investor Presentation Deck
33
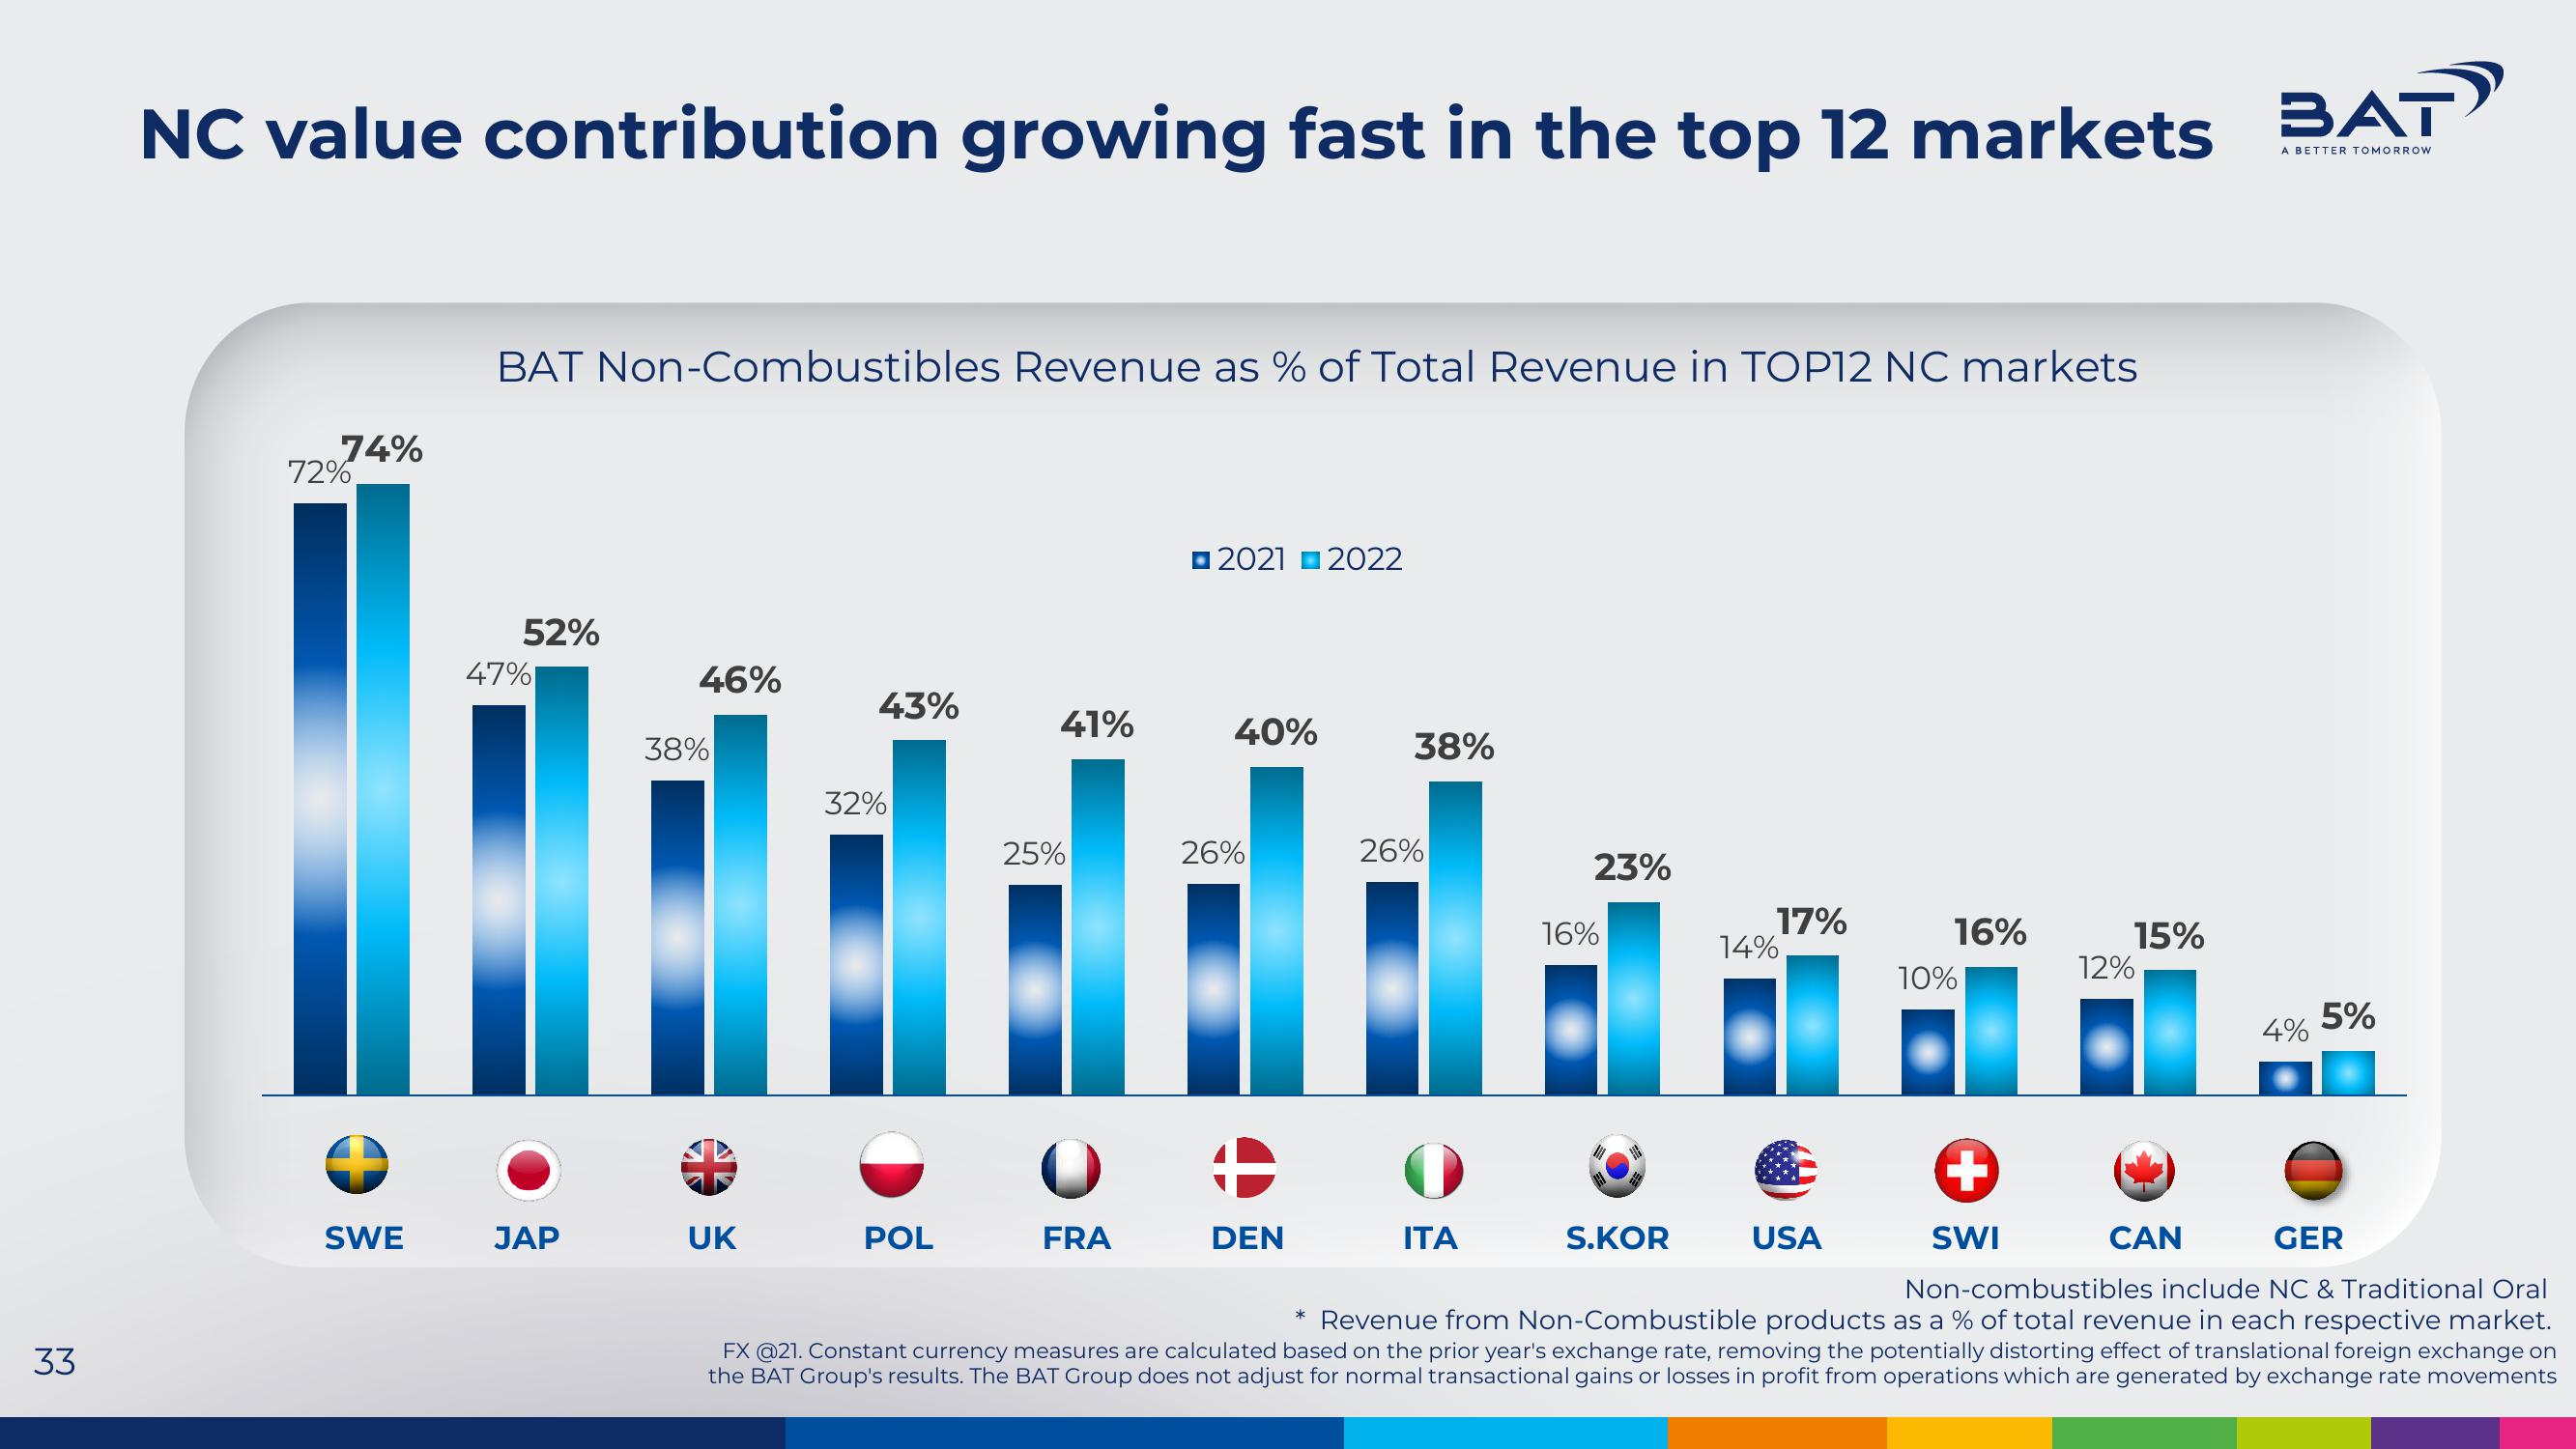
NC value contribution growing fast in the top 12 markets BAT
BETTER TOMORROW
74%
72%
SWE
BAT Non-Combustibles Revenue as % of Total Revenue in TOP12 NC markets
52%
47%
JAP
46%
38%
UK
43%
32%
POL
41%
25%
O
FRA
2021 2022
40%
26%
DEN
38%
26%
ITA
23%
16%
S.KOR
17%
14%
USA
16%
10%
+
SWI
GER
Non-combustibles include NC & Traditional Oral
* Revenue from Non-Combustible products as a % of total revenue in each respective market.
FX @21. Constant currency measures are calculated based on the prior year's exchange rate, removing the potentially distorting effect of translational foreign exchange on
the BAT Group's results. The BAT Group does not adjust for normal transactional gains or losses in profit from operations which are generated by exchange rate movements
12%
15%
CAN
4%
5%View entire presentation