Verint SPAC Presentation Deck
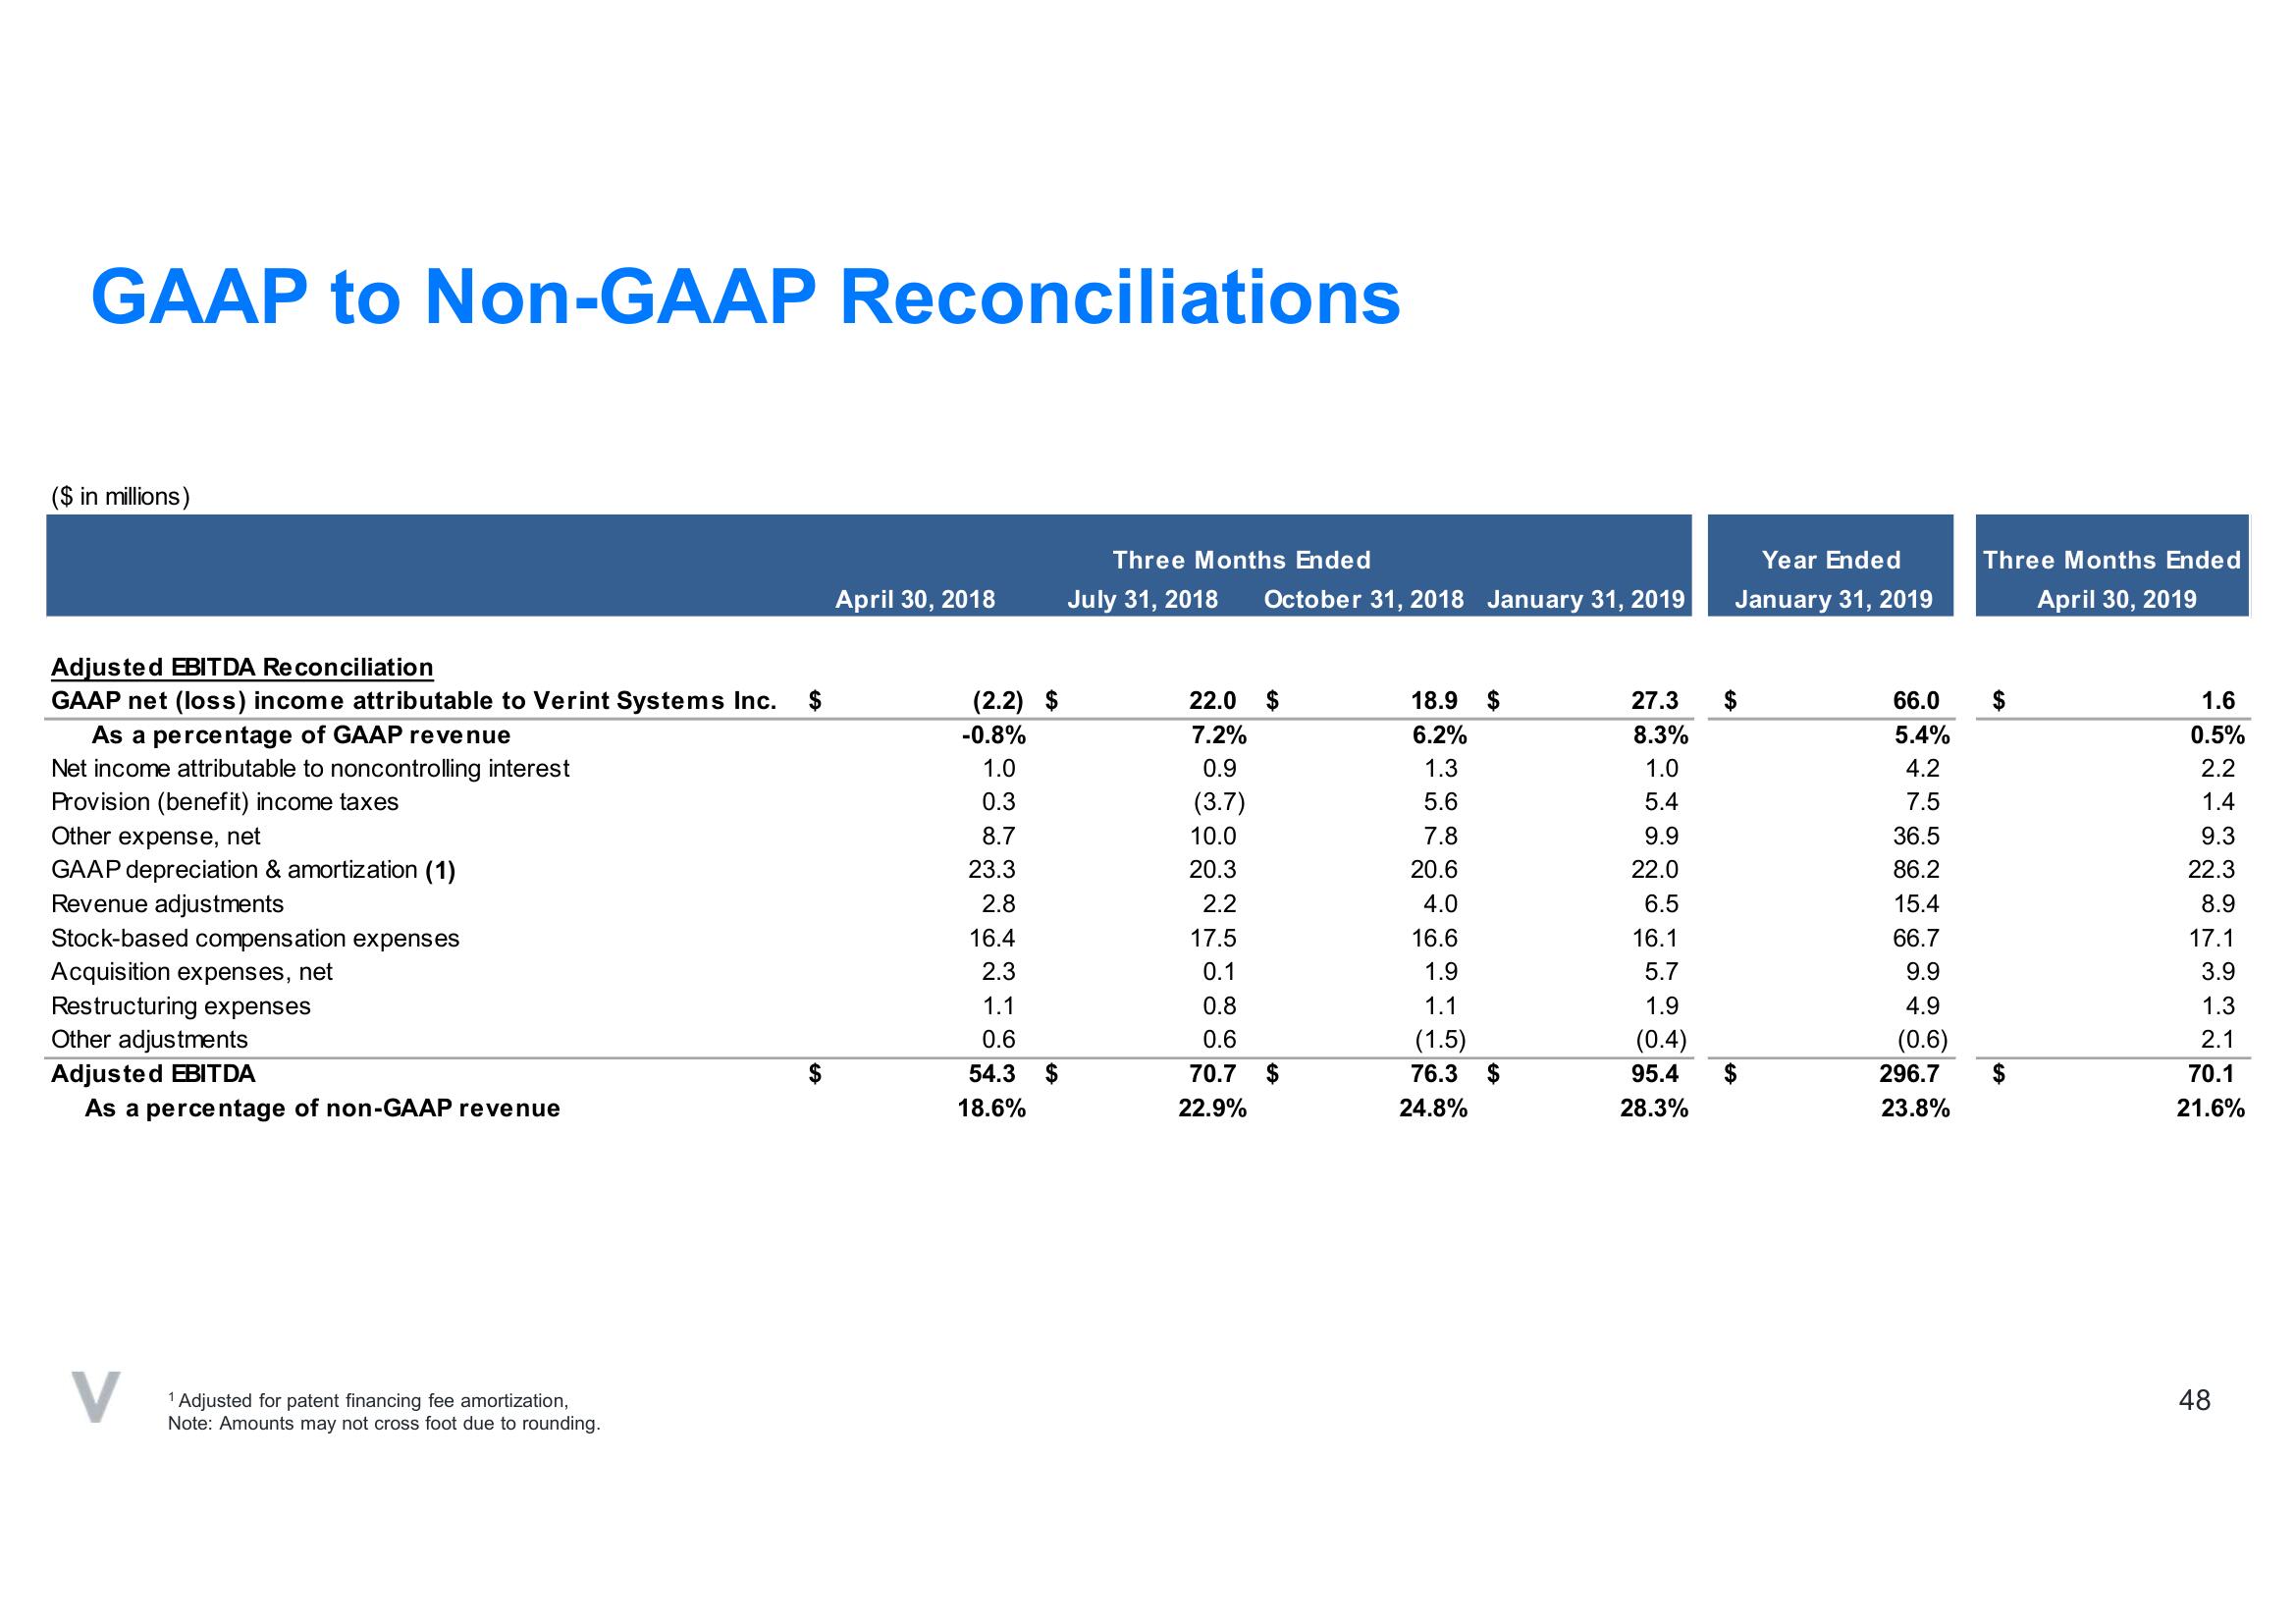
GAAP to Non-GAAP Reconciliations
($ in millions)
Adjusted EBITDA Reconciliation
GAAP net (loss) income attributable to Verint Systems Inc.
$
As a percentage of GAAP revenue
Net income attributable to noncontrolling interest
Provision (benefit) income taxes
Other expense, net
GAAP depreciation & amortization (1)
Revenue adjustments
Stock-based compensation expenses
Acquisition expenses, net
Restructuring expenses
Other adjustments
Adjusted EBITDA
As a percentage of non-GAAP revenue
1 Adjusted for patent financing fee amortization,
Note: Amounts may not cross foot due to rounding.
$
April 30, 2018
(2.2) $
-0.8%
1.0
0.3
8.7
23.3
2.8
16.4
2.3
1.1
0.6
54.3
18.6%
$
Three Months Ended
July 31, 2018
22.0 $
7.2%
0.9
(3.7)
10.0
20.3
2.2
17.5
0.1
0.8
0.6
October 31, 2018 January 31, 2019
70.7
22.9%
$
18.9
6.2%
1.3
5.6
7.8
20.6
4.0
16.6
1.9
1.1
(1.5)
76.3 $
24.8%
$
27.3
8.3%
1.0
5.4
9.9
22.0
6.5
16.1
5.7
1.9
(0.4)
95.4
28.3%
Year Ended
January 31, 2019
$
66.0
5.4%
4.2
7.5
36.5
86.2
15.4
66.7
9.9
4.9
(0.6)
296.7
23.8%
Three Months Ended
April 30, 2019
$
$
1.6
0.5%
2.2
1.4
9.3
22.3
8.9
17.1
3.9
1.3
2.1
70.1
21.6%
48View entire presentation