WeWork SPAC Presentation Deck
Transaction overview (cont'd)
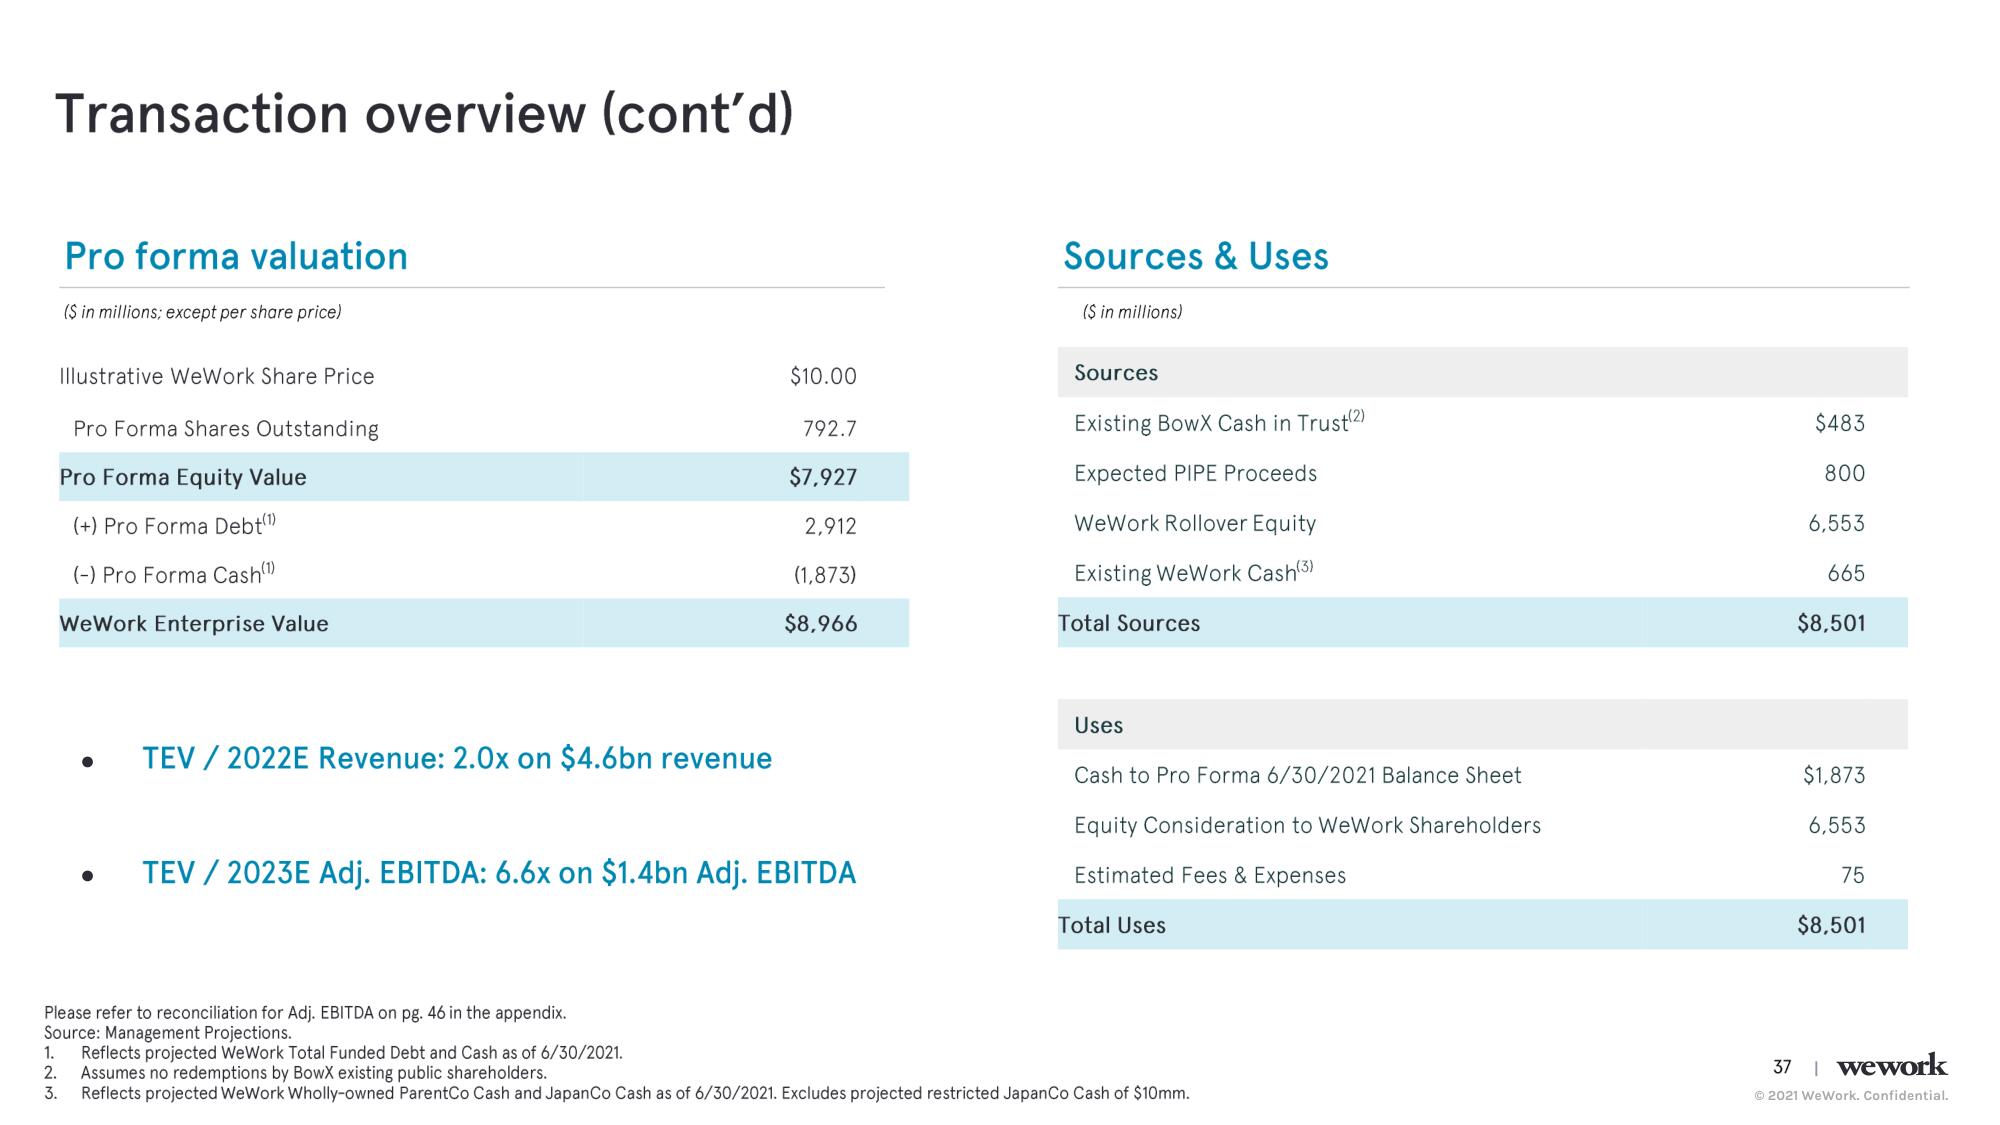
Pro forma valuation
($ in millions; except per share price)
Illustrative WeWork Share Price
Pro Forma Shares Outstanding
Pro Forma Equity Value
(+) Pro Forma Debt(¹)
(-) Pro Forma Cash(1)
We Work Enterprise Value
●
●
TEV / 2022E Revenue: 2.0x on $4.6bn revenue
$10.00
Please refer to reconciliation for Adj. EBITDA on pg. 46 in the appendix.
Source: Management Projections.
1. Reflects projected WeWork Total Funded Debt and Cash as of 6/30/2021.
2.
3.
792.7
$7,927
2,912
(1,873)
$8,966
TEV / 2023E Adj. EBITDA: 6.6x on $1.4bn Adj. EBITDA
Sources & Uses
($ in millions)
Sources
Existing BowX Cash in Trust(2)
Expected PIPE Proceeds
WeWork Rollover Equity
Existing WeWork Cash(3)
Total Sources
Uses
Cash to Pro Forma 6/30/2021 Balance Sheet
Equity Consideration to WeWork Shareholders
Estimated Fees & Expenses
Total Uses
Assumes no redemptions by BowX existing public shareholders.
Reflects projected WeWork Wholly-owned ParentCo Cash and Japan Co Cash as of 6/30/2021. Excludes projected restricted Japan Co Cash of $10mm.
$483
800
6,553
665
$8,501
$1,873
6,553
75
$8,501
37 | wework
Ⓒ2021 WeWork. Confidential.View entire presentation