GMS Results Presentation Deck
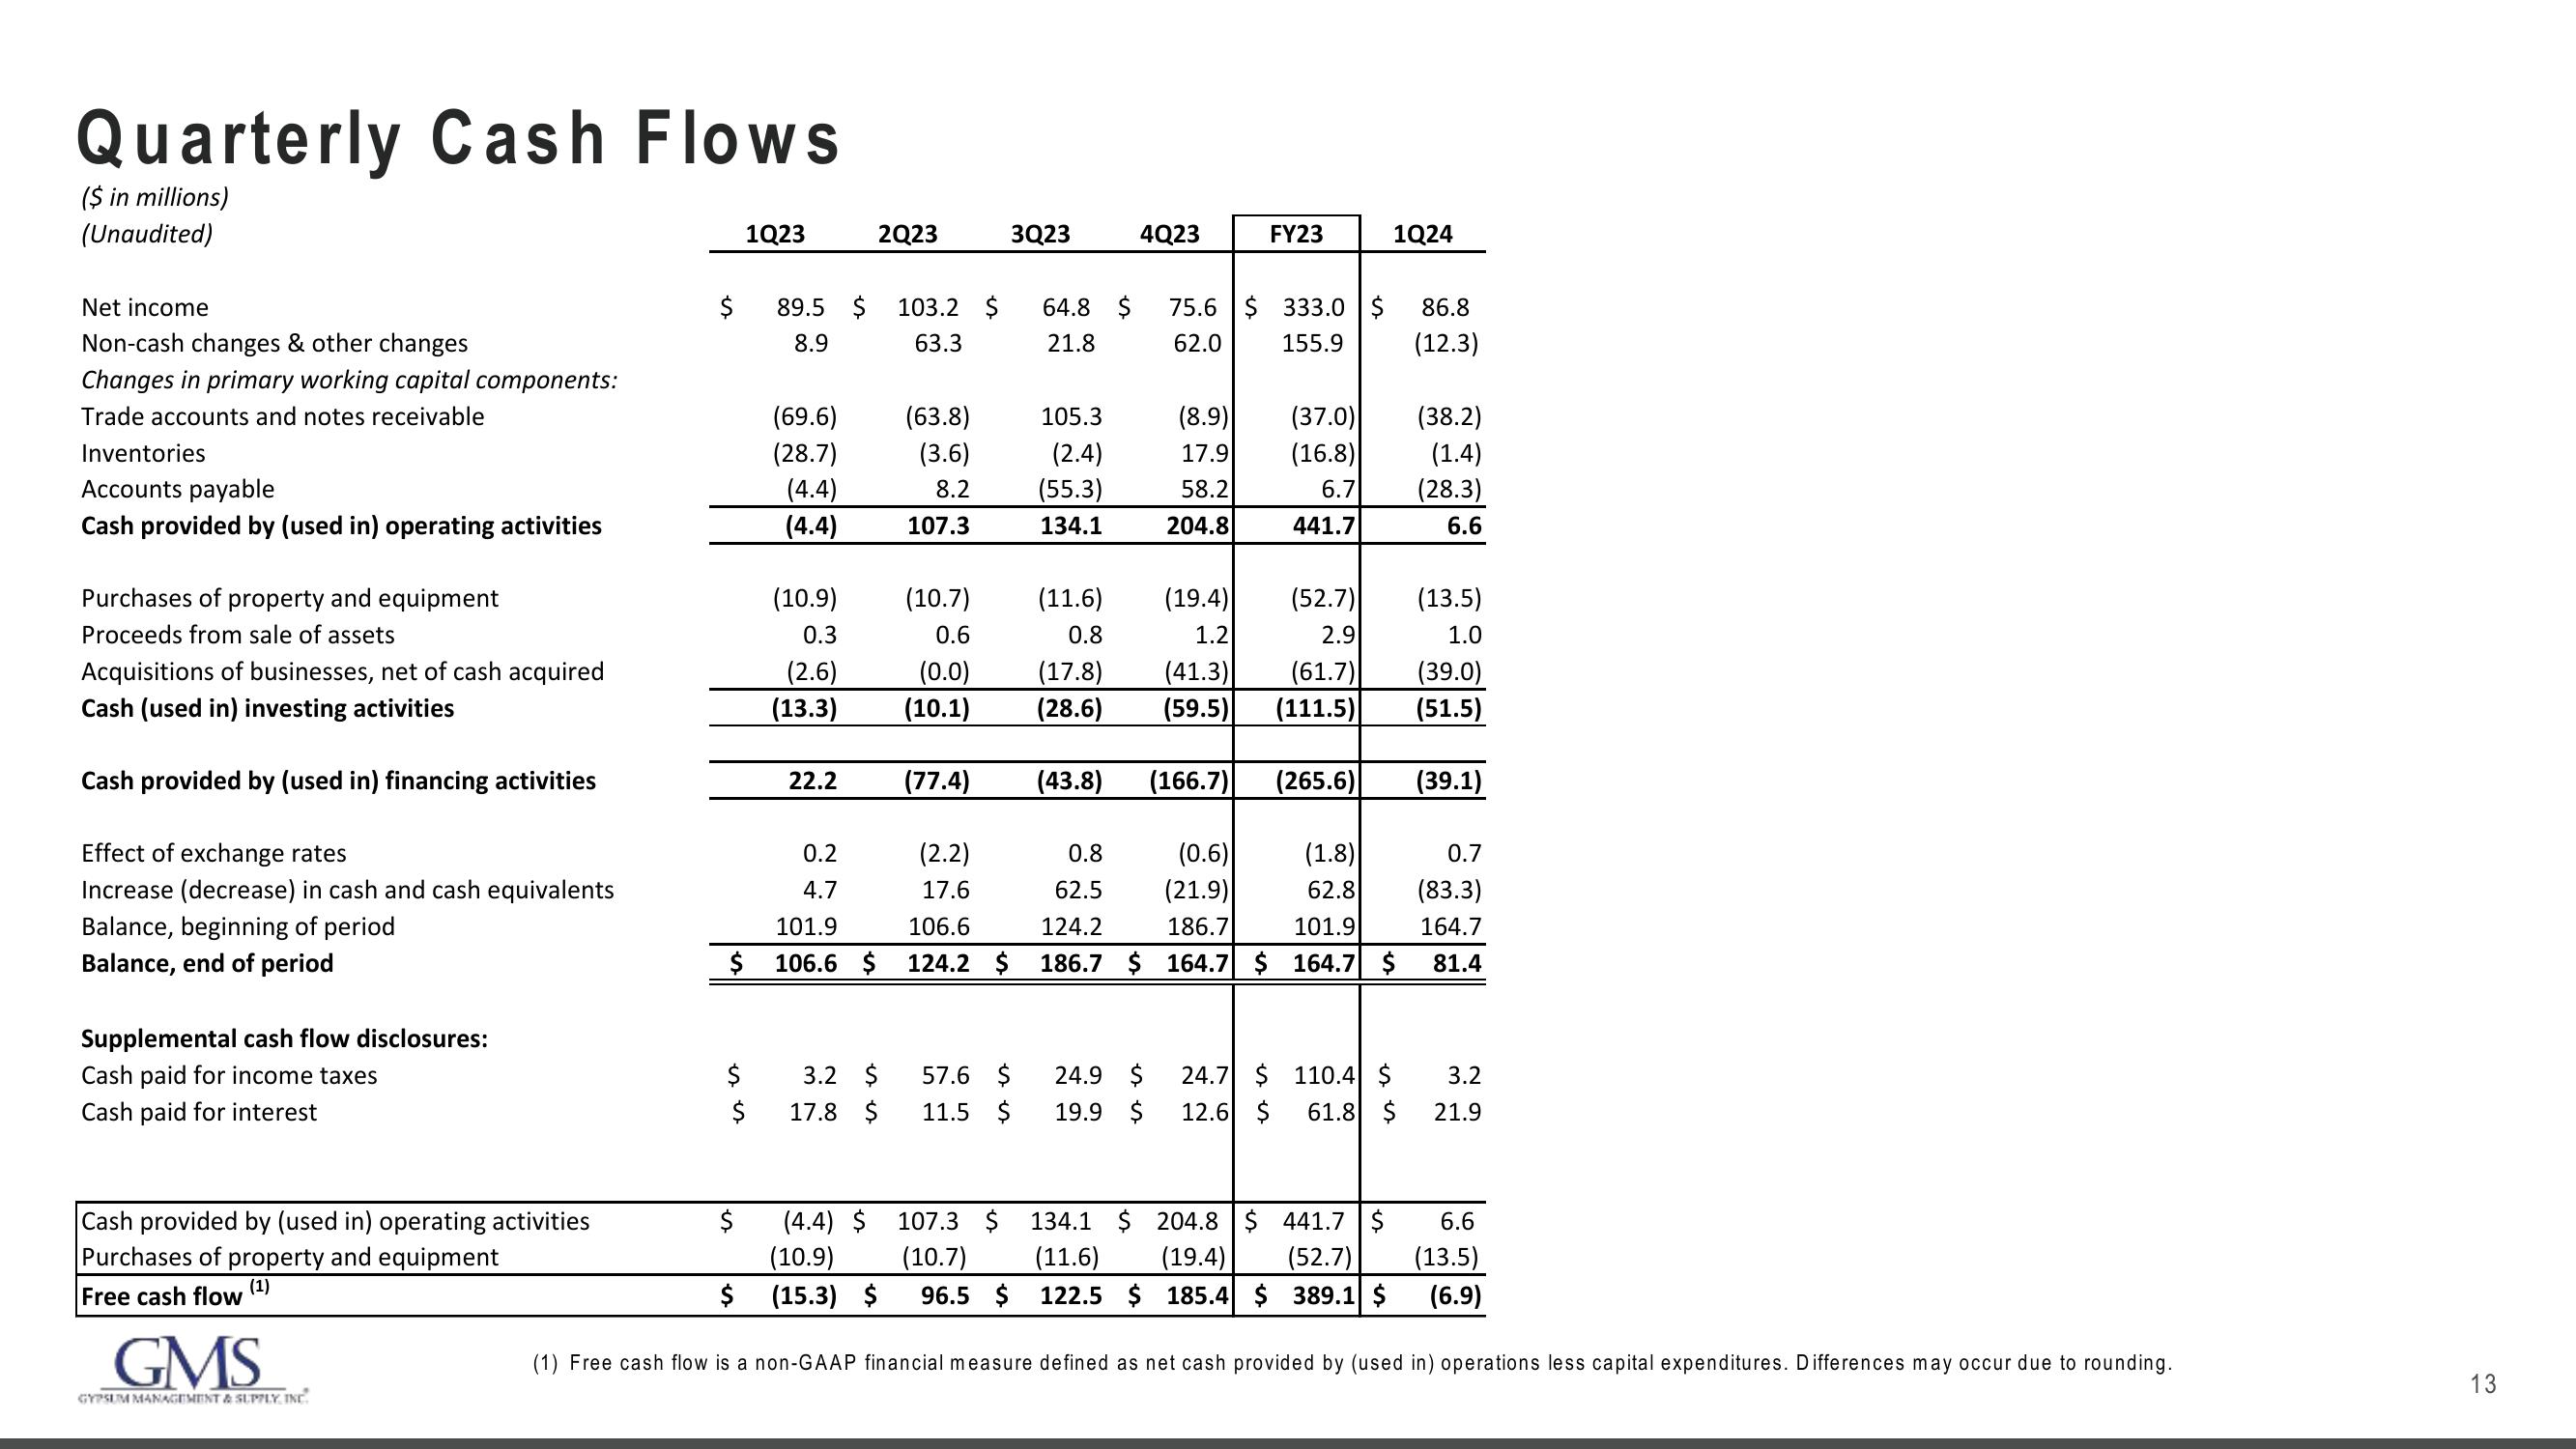
Quarterly Cash Flows
($ in millions)
(Unaudited)
Net income
Non-cash changes & other changes
Changes in primary working capital components:
Trade accounts and notes receivable
Inventories
Accounts payable
Cash provided by (used in) operating activities
Purchases of property and equipment
Proceeds from sale of assets
Acquisitions of businesses, net of cash acquired
Cash (used in) investing activities
Cash provided by (used in) financing activities
Effect of exchange rates
Increase (decrease) in cash and cash equivalents
Balance, beginning of period
Balance, end of period
Supplemental cash flow disclosures:
Cash paid for income taxes
Cash paid for interest
Cash provided by (used in) operating activities
Purchases of property and equipment
(1)
Free cash flow
GMS
GYPSUM MANAGEMENT & SUPPLY INC.
$ 89.5 $ 103.2 $
8.9
63.3
$
1Q23
$
$
0.2
4.7
101.9
$ 106.6 $
(69.6)
(28.7)
(4.4)
(4.4)
$
(10.9)
0.3
(2.6)
(13.3)
22.2
2Q23
3.2 $
17.8 $
3Q23
(63.8) 105.3
(3.6)
8.2
107.3
(2.2)
17.6
(10.7) (11.6)
0.6
(0.0)
0.8
(17.8)
(28.6)
(10.1)
106.6
124.2 $
(77.4) (43.8)
64.8 $ 75.6 $ 333.0 $
21.8
62.0
155.9
(2.4)
(55.3)
134.1
57.6 $
11.5 $
4Q23
FY23
(8.9)
17.9
58.2
204.8
24.9 $
19.9 $
(37.0)
(16.8)
6.7
441.7
(19.4) (52.7)
1.2
2.9
(41.3) (61.7)
(59.5) (111.5)
(166.7) (265.6)
0.8
(0.6)
62.5
(21.9)
124.2
101.9
186.7
186.7 $ 164.7 $ 164.7 $
(1.8)
62.8
1Q24
24.7 $110.4 $
12.6 $ 61.8 $
107.3 $
(10.7)
96.5 $122.5 $ 185.4 $ 389.1 $
134.1 $ 204.8 $ 441.7 $
(11.6) (19.4) (52.7)
86.8
(12.3)
(38.2)
(1.4)
(28.3)
6.6
(13.5)
1.0
(39.0)
(51.5)
(39.1)
(4.4) $
(10.9)
(15.3) $
(1) Free cash flow is a non-GAAP financial measure defined as net cash provided by (used in) operations less capital expenditures. Differences may occur due to rounding.
0.7
(83.3)
164.7
81.4
3.2
21.9
6.6
(13.5)
(6.9)
13View entire presentation