Asos Results Presentation Deck
© 2022 asos
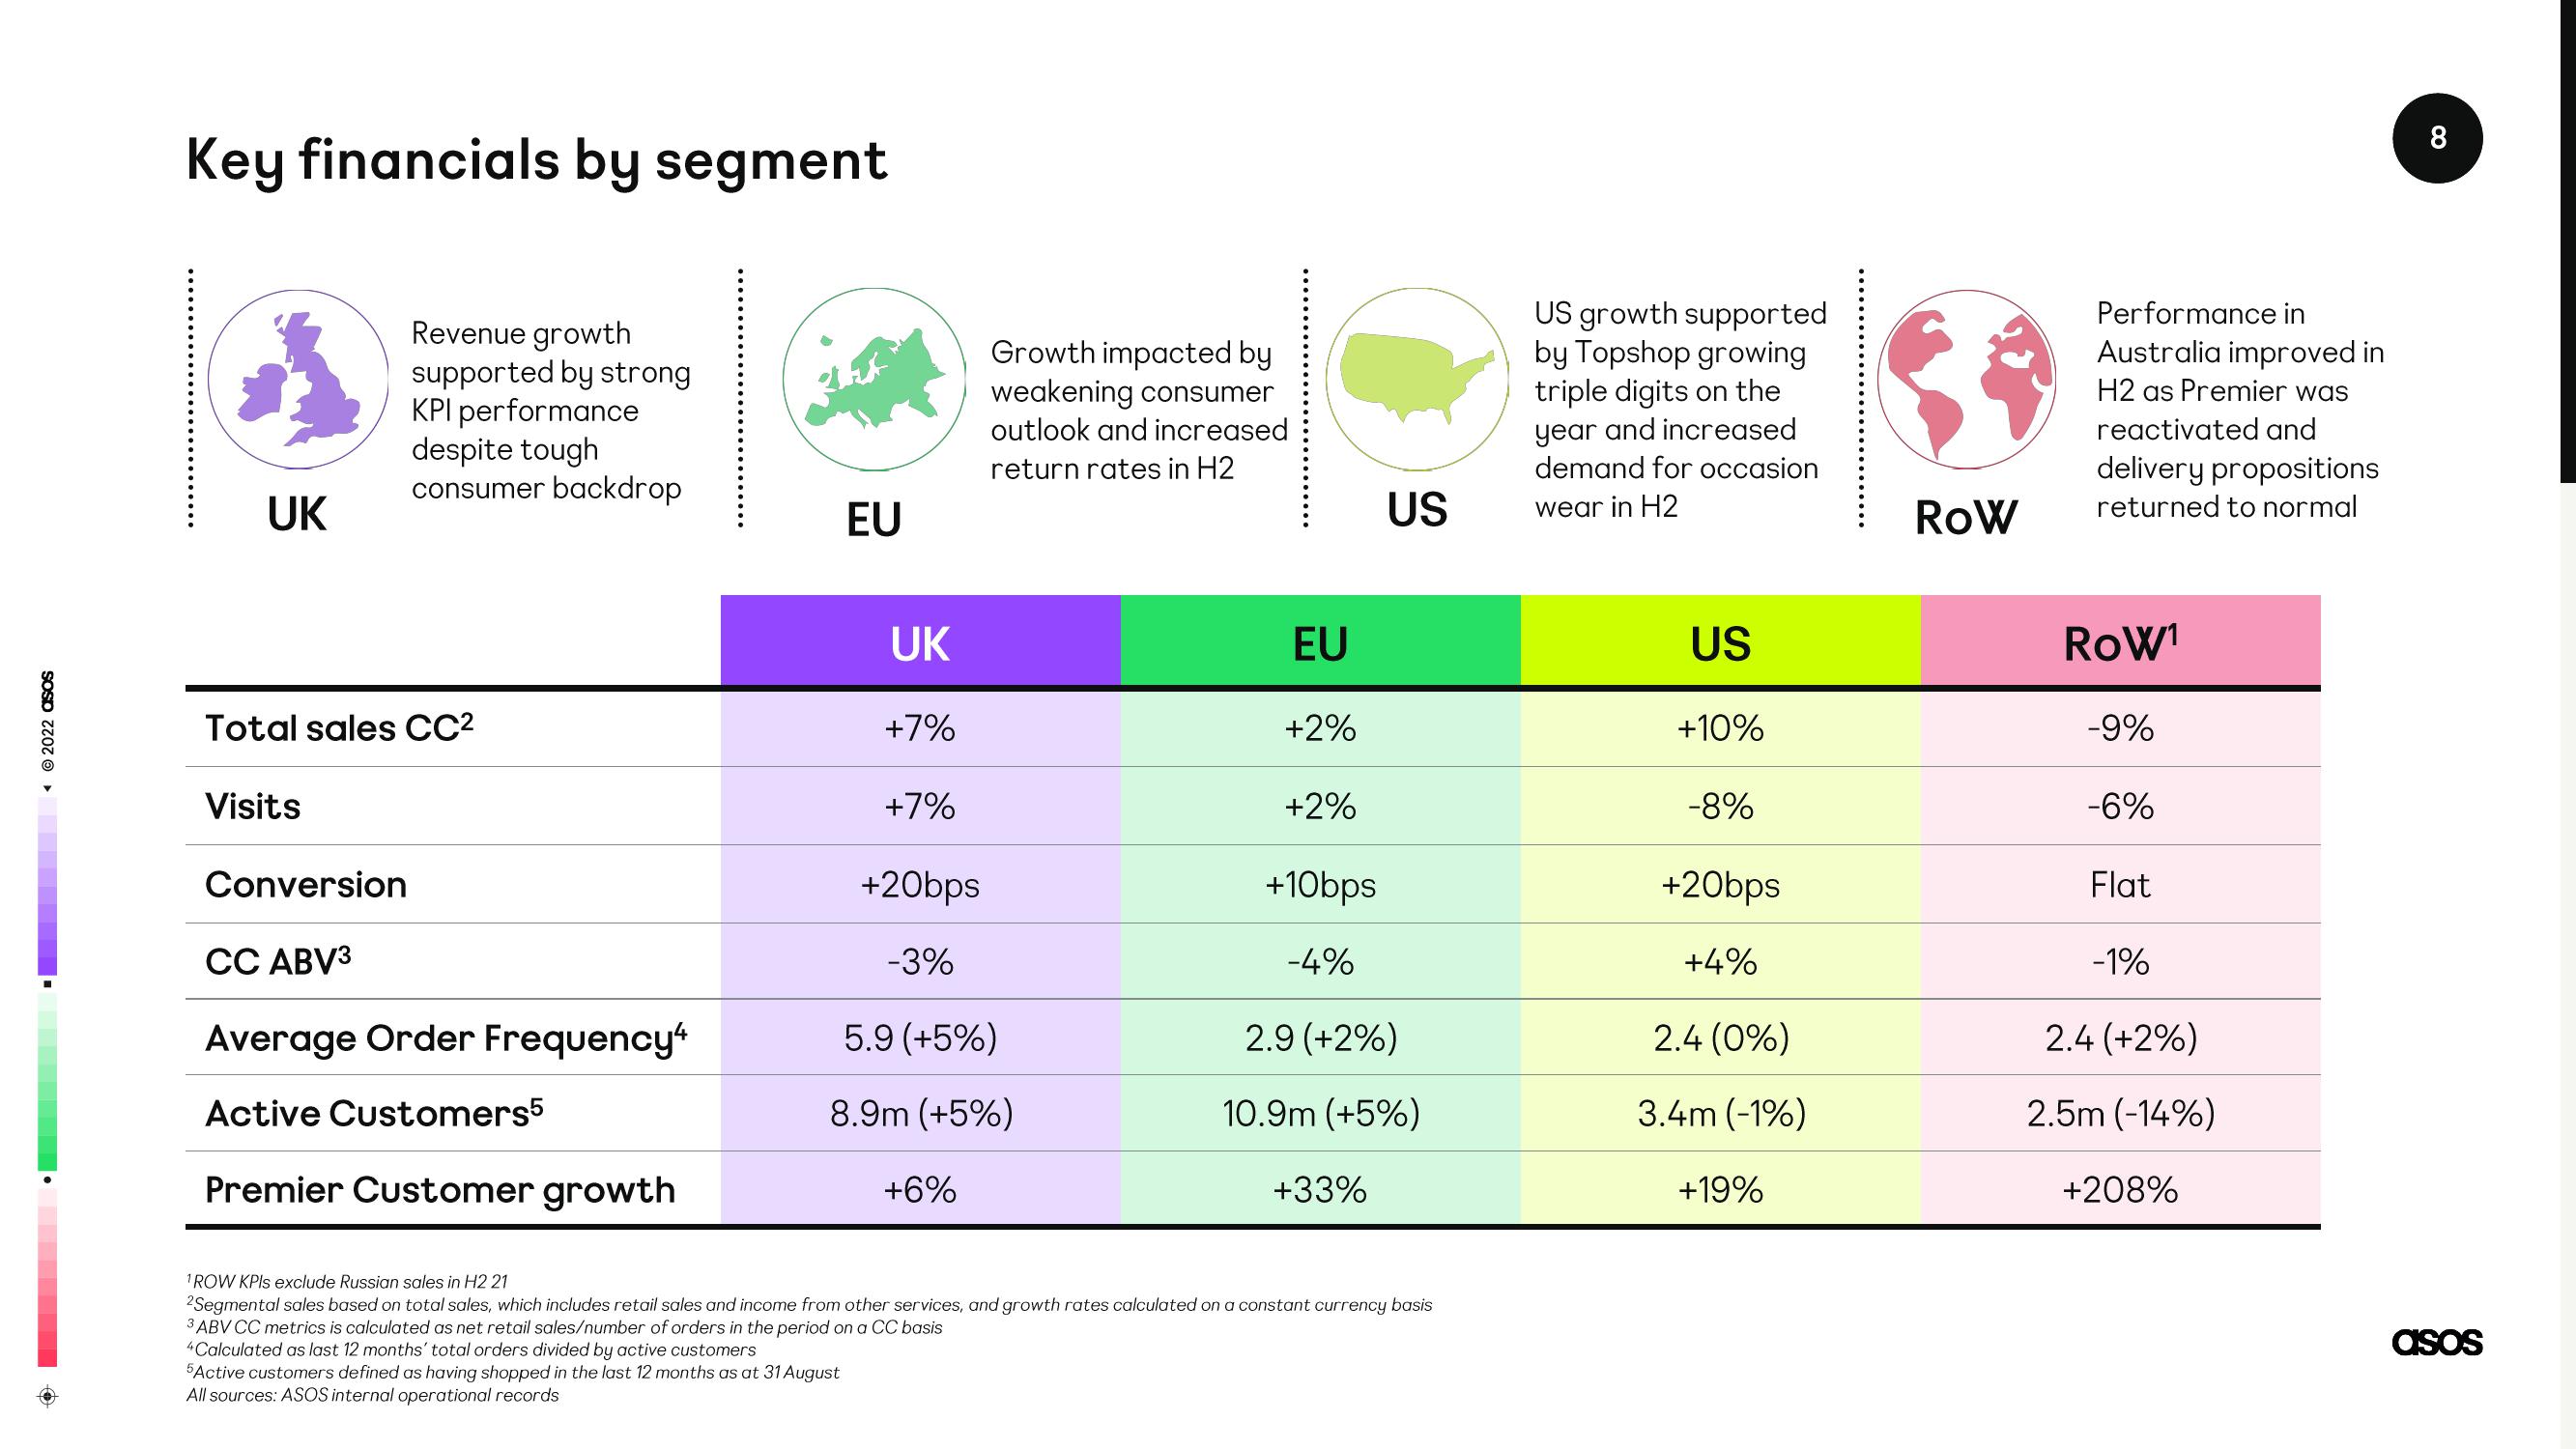
Key financials by segment
UK
Revenue growth
supported by strong
KPI performance
despite tough
consumer backdrop
Total sales CC²
Visits
Conversion
CC ABV3
Average Order Frequency4
Active Customers5
Premier Customer growth
EU
UK
+7%
+7%
+20bps
-3%
Growth impacted by
weakening consumer
outlook and increased
return rates in H2
5.9 (+5%)
8.9m (+5%)
+6%
EU
+2%
+2%
+10bps
-4%
US
2.9 (+2%)
10.9m (+5%)
+33%
¹ROW KPIs exclude Russian sales in H2 21
2Segmental sales based on total sales, which includes retail sales and income from other services, and growth rates calculated on a constant currency basis
3 ABV CC metrics is calculated as net retail sales/number of orders in the period on a CC basis
4Calculated as last 12 months' total orders divided by active customers
5Active customers defined as having shopped in the last 12 months as at 31 August
All sources: ASOS internal operational records
US growth supported
by Topshop growing
triple digits on the
year and increased
demand for occasion
wear in H2
US
+10%
-8%
+20bps
+4%
2.4 (0%)
3.4m (-1%)
+19%
ROW
Performance in
Australia improved in
H2 as Premier was
reactivated and
delivery propositions
returned to normal
ROW¹
-9%
-6%
Flat
-1%
2.4 (+2%)
2.5m (-14%)
+208%
8
asosView entire presentation