FIGS Results Presentation Deck
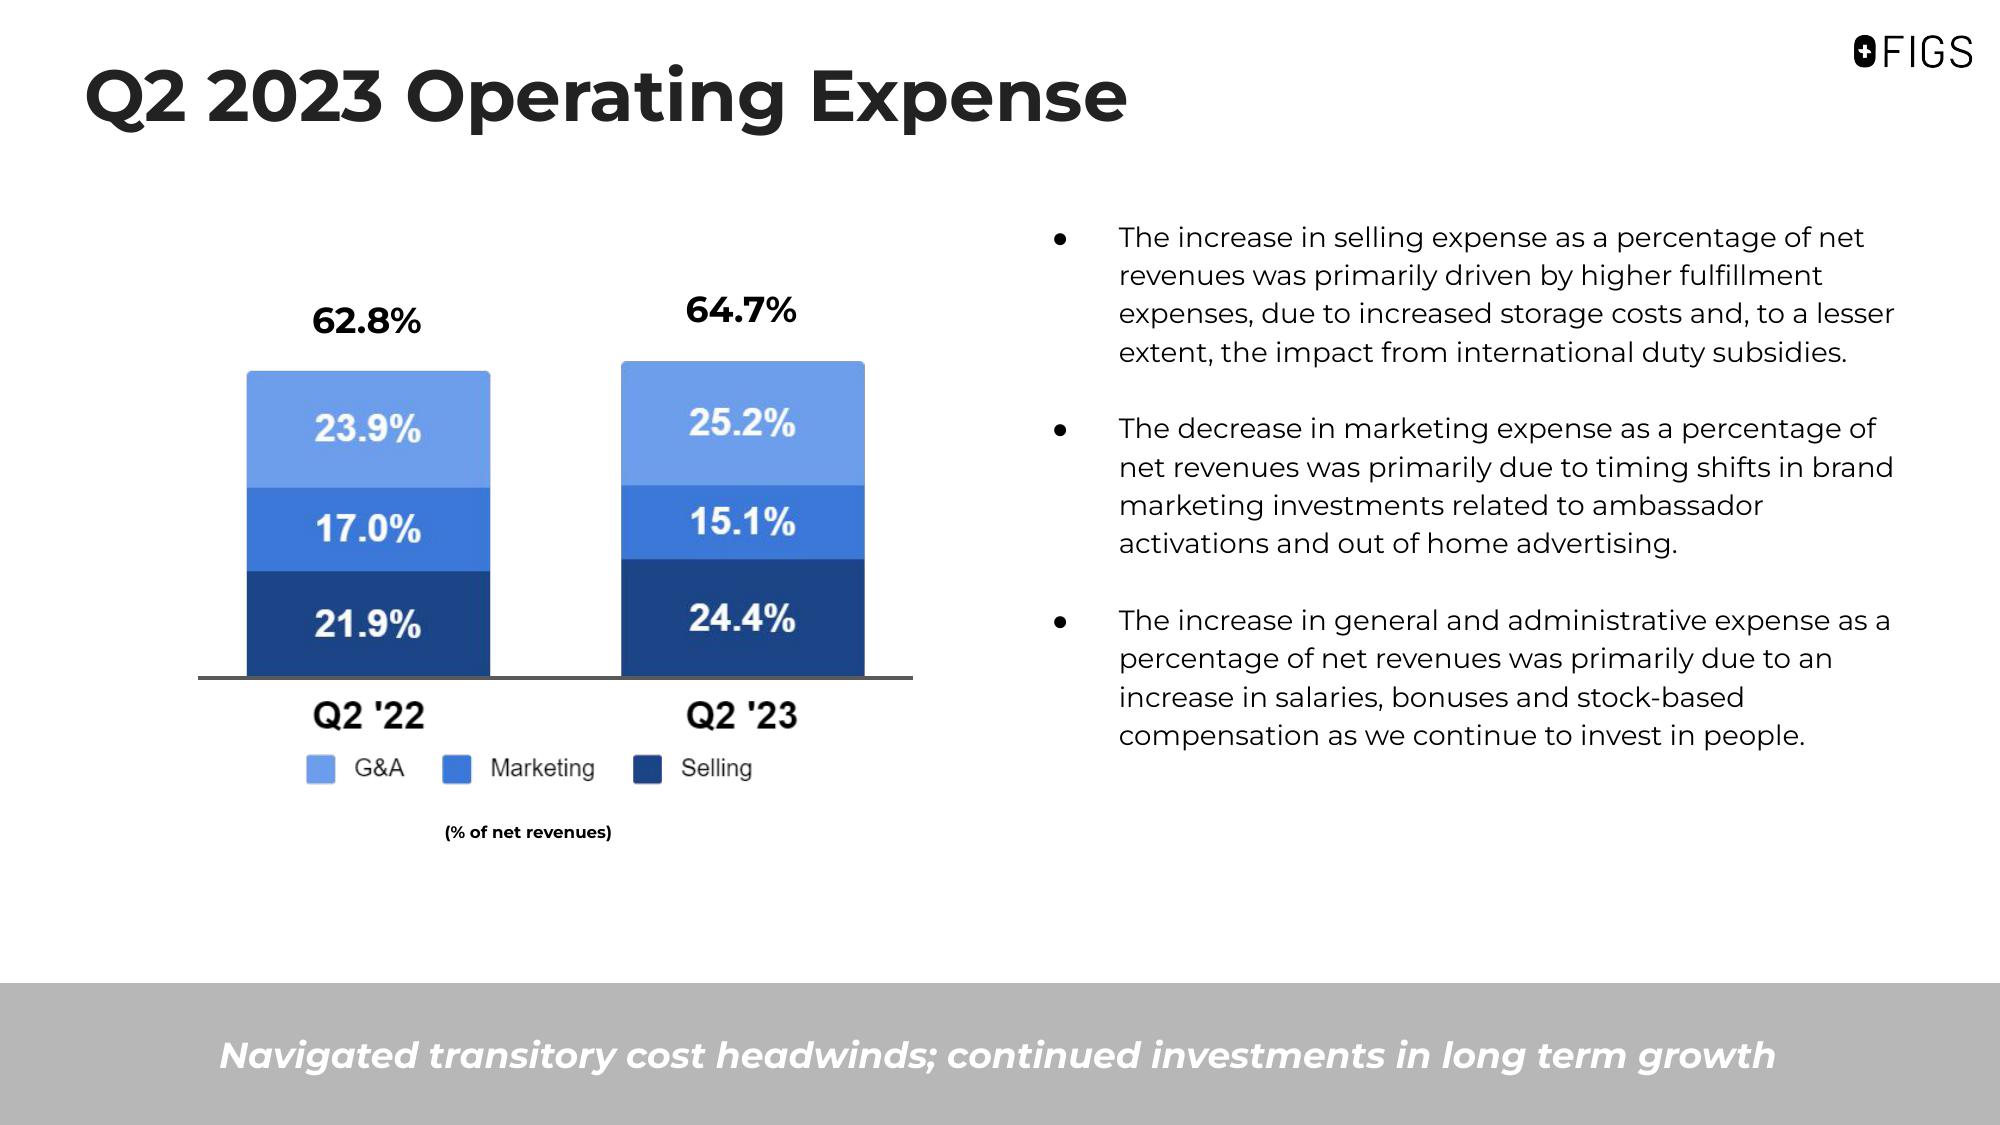
Q2 2023 Operating Expense
62.8%
23.9%
17.0%
21.9%
Q2 '22
G&A
Marketing
(% of net revenues)
64.7%
25.2%
15.1%
24.4%
Q2 '23
Selling
OFIGS
The increase in selling expense as a percentage of net
revenues was primarily driven by higher fulfillment
expenses, due to increased storage costs and, to a lesser
extent, the impact from international duty subsidies.
The decrease in marketing expense as a percentage of
net revenues was primarily due to timing shifts in brand
marketing investments related to ambassador
activations and out of home advertising.
The increase in general and administrative expense as a
percentage of net revenues was primarily due to an
increase in salaries, bonuses and stock-based
compensation as we continue to invest in people.
Navigated transitory cost headwinds; continued investments in long term growthView entire presentation