Comcast Results Presentation Deck
Content &
Experiences
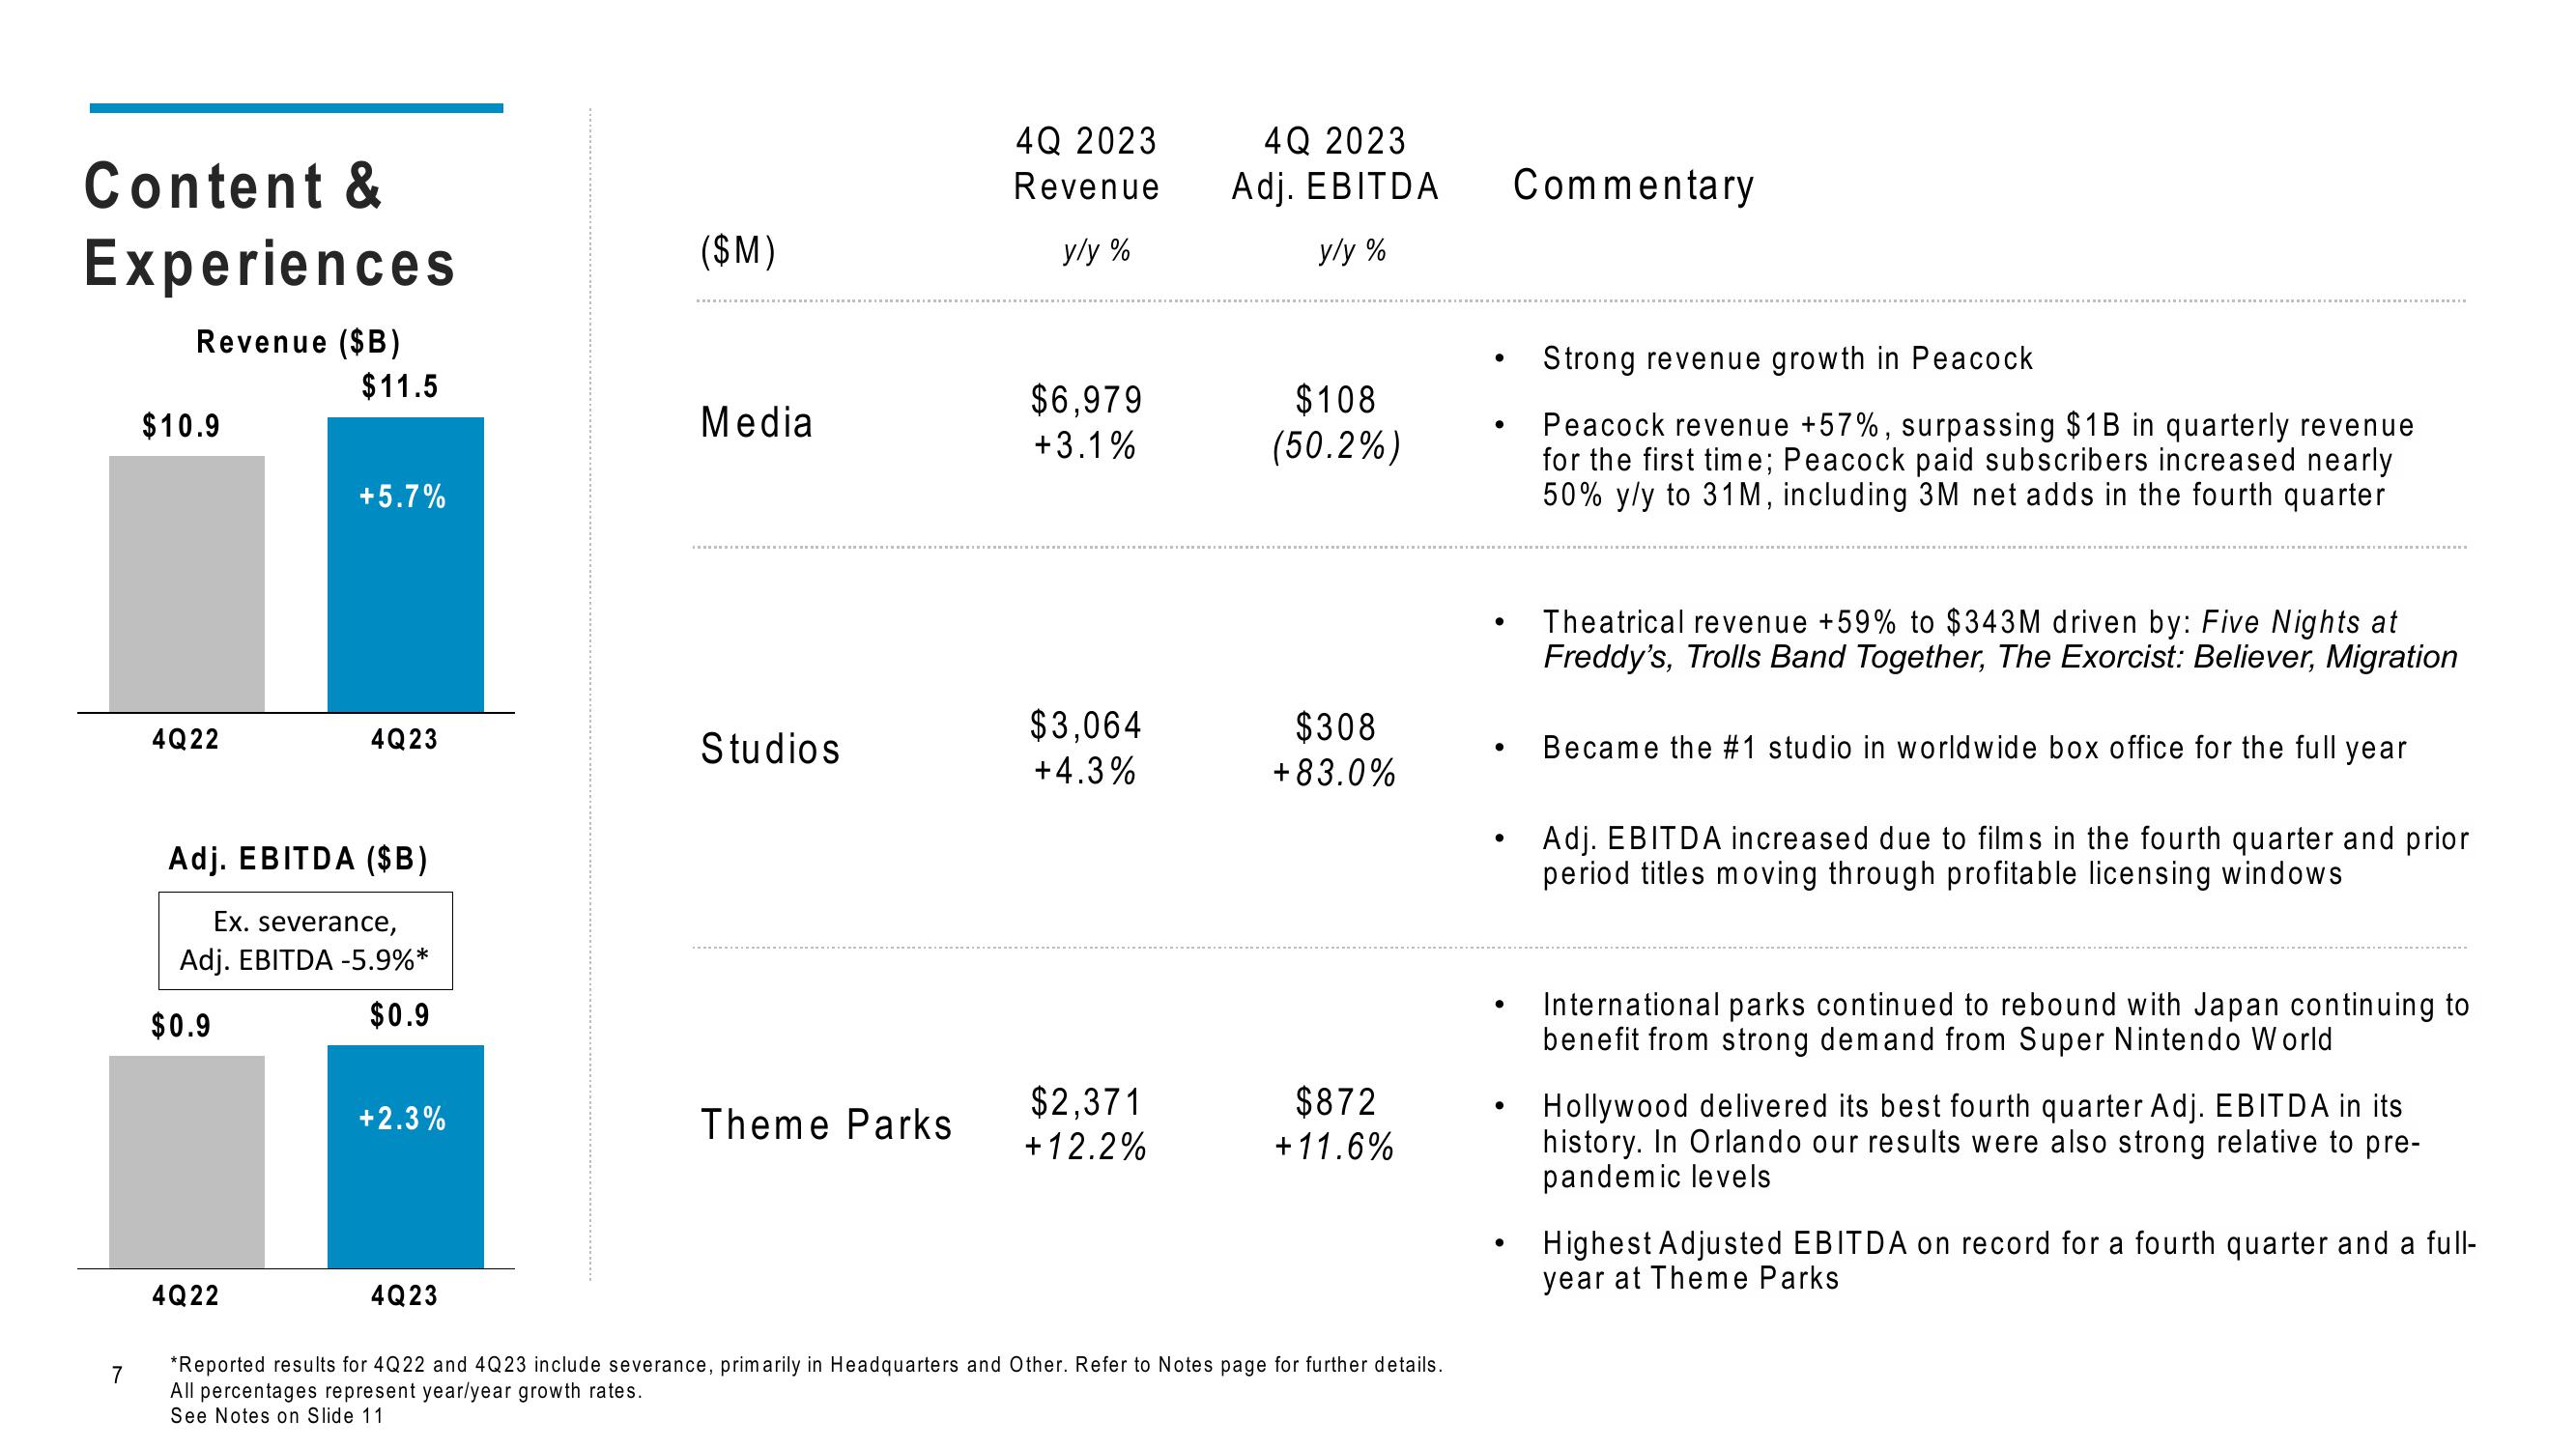
Revenue ($B)
7
$10.9
4Q22
$0.9
$11.5
4Q22
+5.7%
Adj. EBITDA ($B)
Ex. severance,
Adj. EBITDA -5.9%*
$0.9
4Q23
+2.3%
4Q23
($M)
Media
Studios
Theme Parks
4Q 2023
Revenue
y/y%
$6,979
+3.1%
$3,064
+4.3%
$2,371
+ 12.2%
4Q 2023
Adj. EBITDA
y/y%
$108
(50.2%)
$308
+83.0%
$872
+11.6%
*Reported results for 4Q22 and 4Q23 include severance, primarily in Headquarters and Other. Refer to Notes page for further details.
All percentages represent year/year growth rates.
See Notes on Slide 11
●
●
●
●
●
Commentary
Strong revenue growth in Peacock
Peacock revenue +57%, surpassing $1B in quarterly revenue
for the first time; Peacock paid subscribers increased nearly
50% y/y to 31M, including 3M net adds in the fourth quarter
Theatrical revenue +59% to $343M driven by: Five Nights at
Freddy's, Trolls Band Together, The Exorcist: Believer, Migration
Became the #1 studio in worldwide box office for the full year
Adj. EBITDA increased due to films in the fourth quarter and prior
period titles moving through profitable licensing windows
International parks continued to rebound with Japan continuing to
benefit from strong demand from Super Nintendo World
Hollywood delivered its best fourth quarter Adj. EBITDA in its
history. In Orlando our results were also strong relative to pre-
pandemic levels
Highest Adjusted EBITDA on record for a fo
year at Theme Parks
quarter and a full-View entire presentation