Marti SPAC Presentation Deck
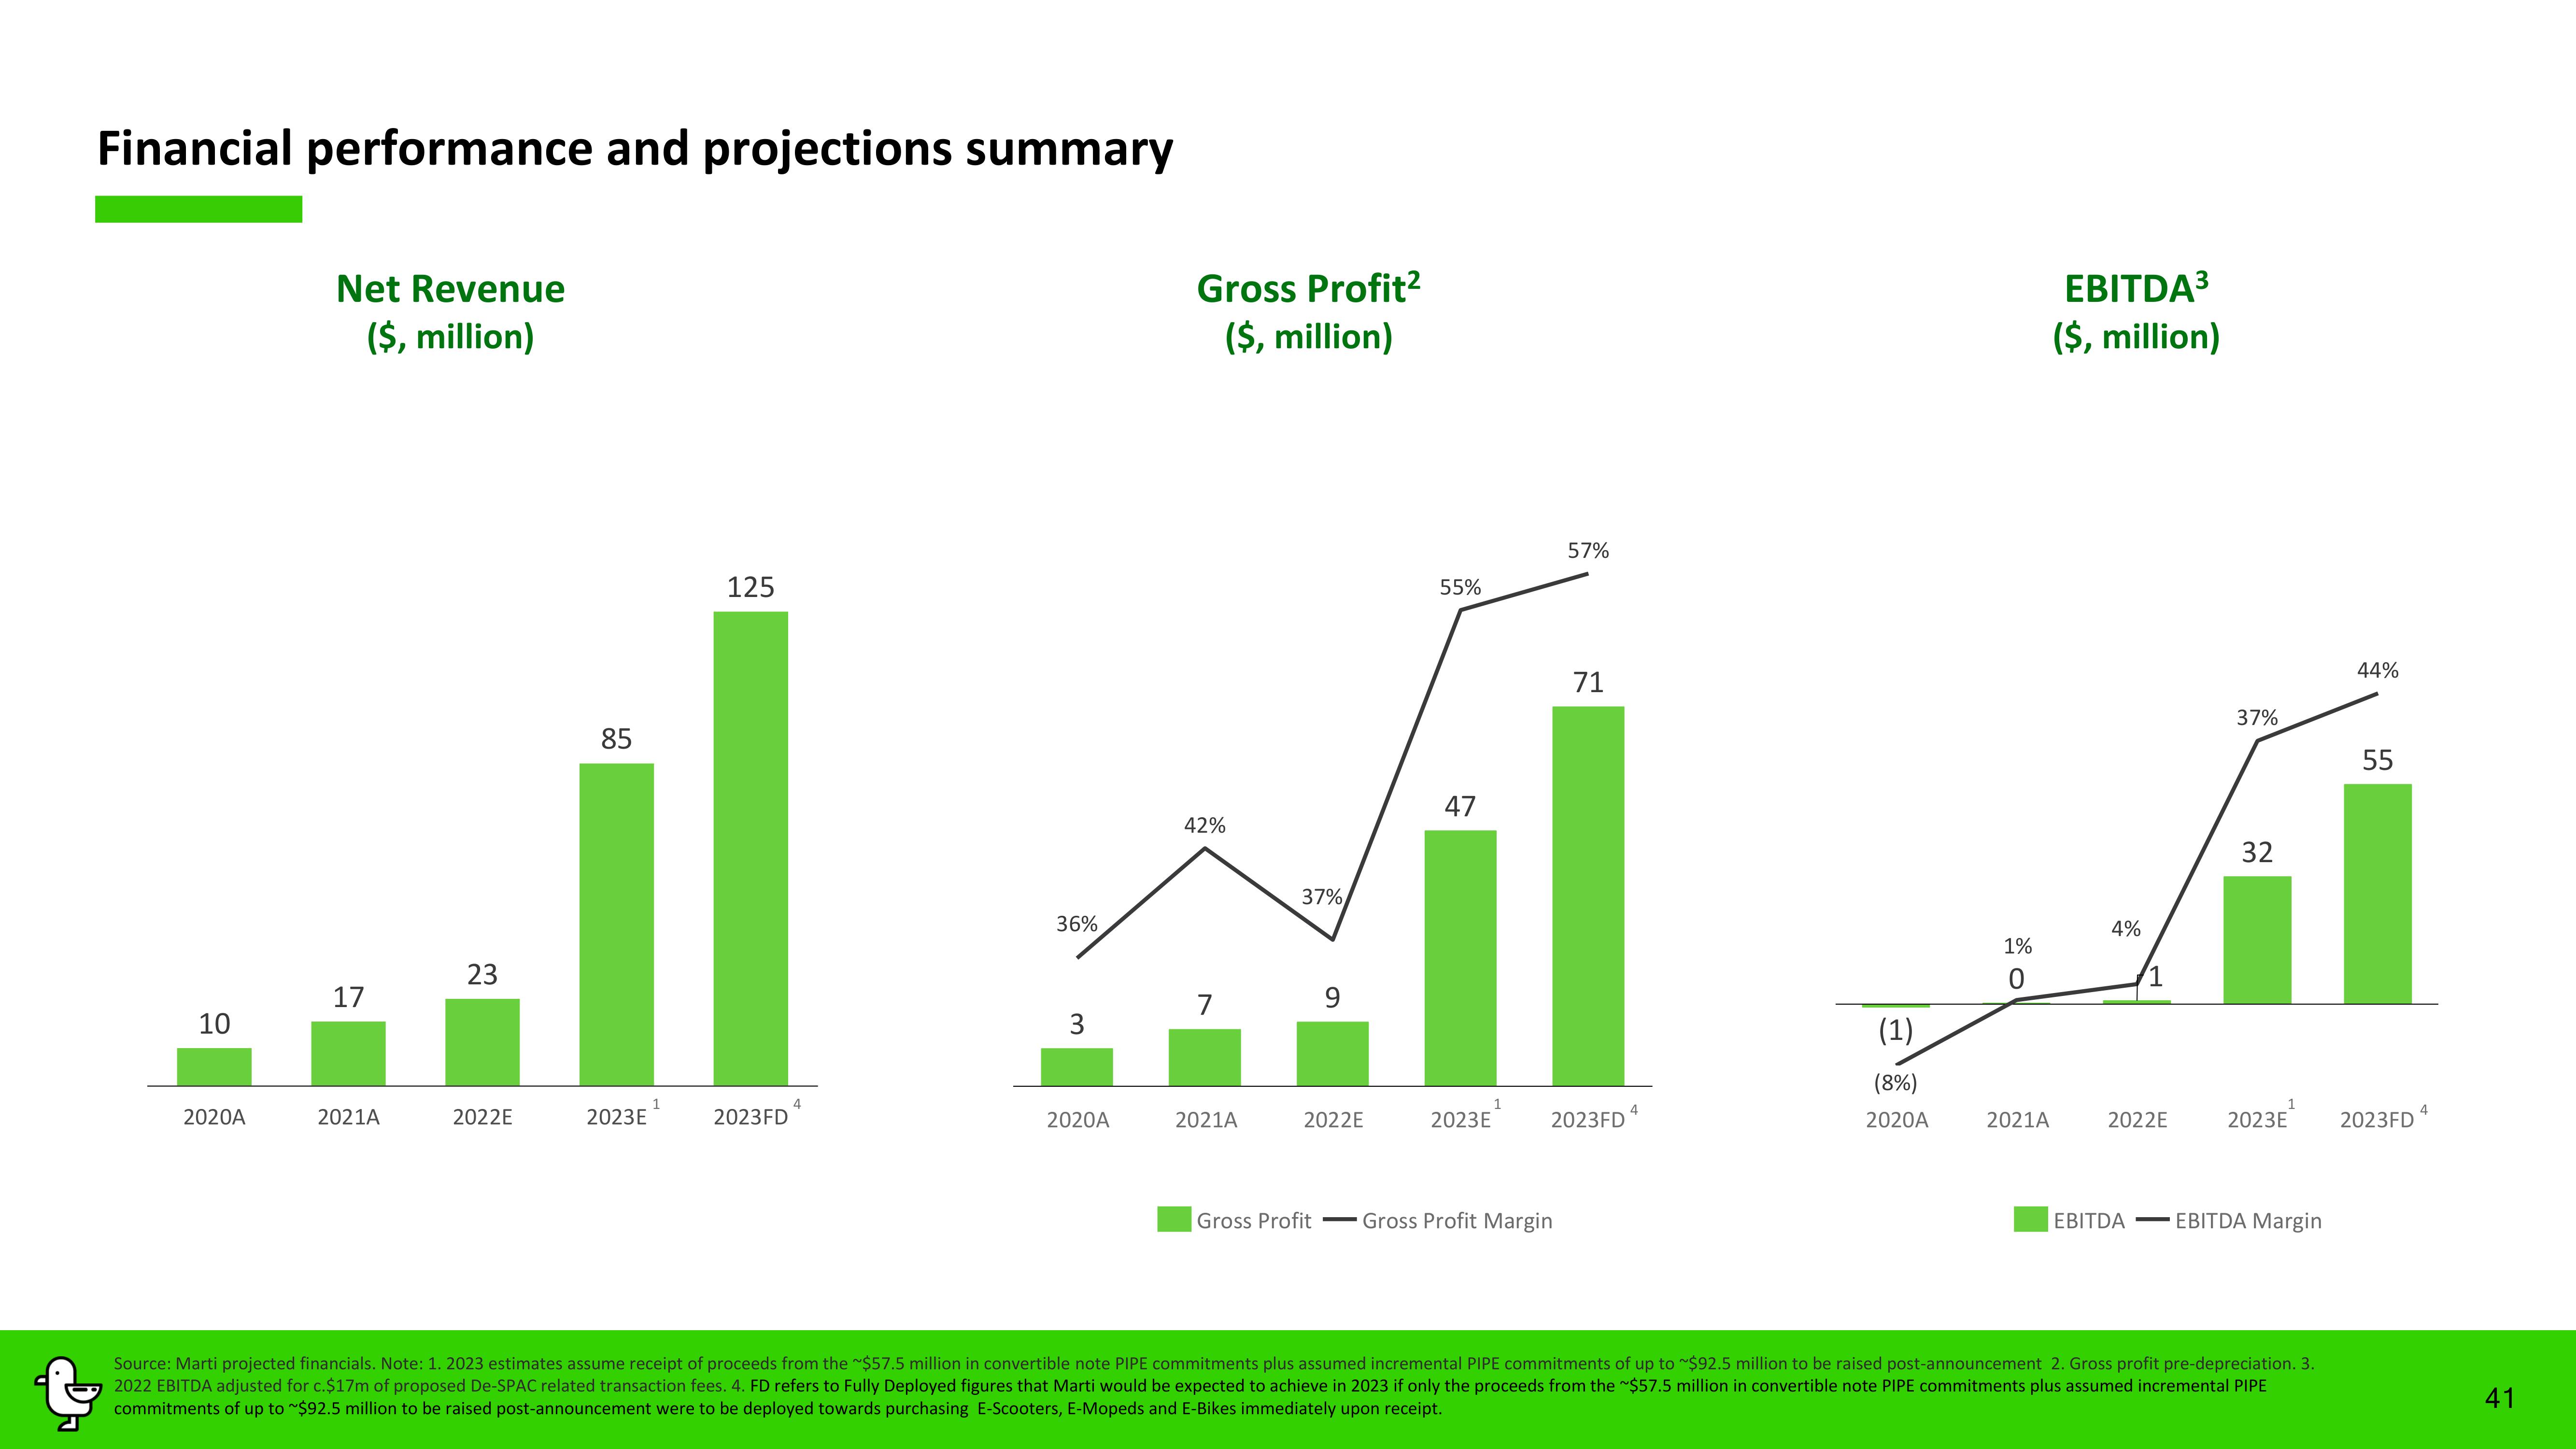
Financial performance and projections summary
10
2020A
Net Revenue
($, million)
17
2021A
23
2022E
85
2023E
125
2023FD
36%
3
2020A
Gross Profit²
($, million)
42%
7
2021A
37%
9
2022E
55%
47
2023E
57%
Gross Profit Gross Profit Margin
71
2023FD
4
(1)
(8%)
2020A
1%
0
2021A
EBITDA³
($, million)
4%
1
2022E
37%
32
2023E
EBITDAEBITDA Margin
Source: Marti projected financials. Note: 1. 2023 estimates assume receipt of proceeds from the ~$57.5 million in convertible note PIPE commitments plus assumed incremental PIPE commitments of up to $92.5 million to be raised post-announcement 2. Gross profit pre-depreciation. 3.
2022 EBITDA adjusted for c.$17m of proposed De-SPAC related transaction fees. 4. FD refers to Fully Deployed figures that Marti would be expected to achieve in 2023 if only the proceeds from the ~$57.5 million in convertible note PIPE commitments plus assumed incremental PIPE
commitments of up to ~$92.5 million to be raised post-announcement were to be deployed towards purchasing E-Scooters, E-Mopeds and E-Bikes immediately upon receipt.
44%
55
2023FD
4
41View entire presentation