AG Direct Lending SMA
ANGELO
AG GORDON
A Market Leader: Pitchbook League Table Results
Count
9,000
8,000
7,000
6,000
5,000
4,000
3,000
2,000
1,000
0
50%
727
4.5%
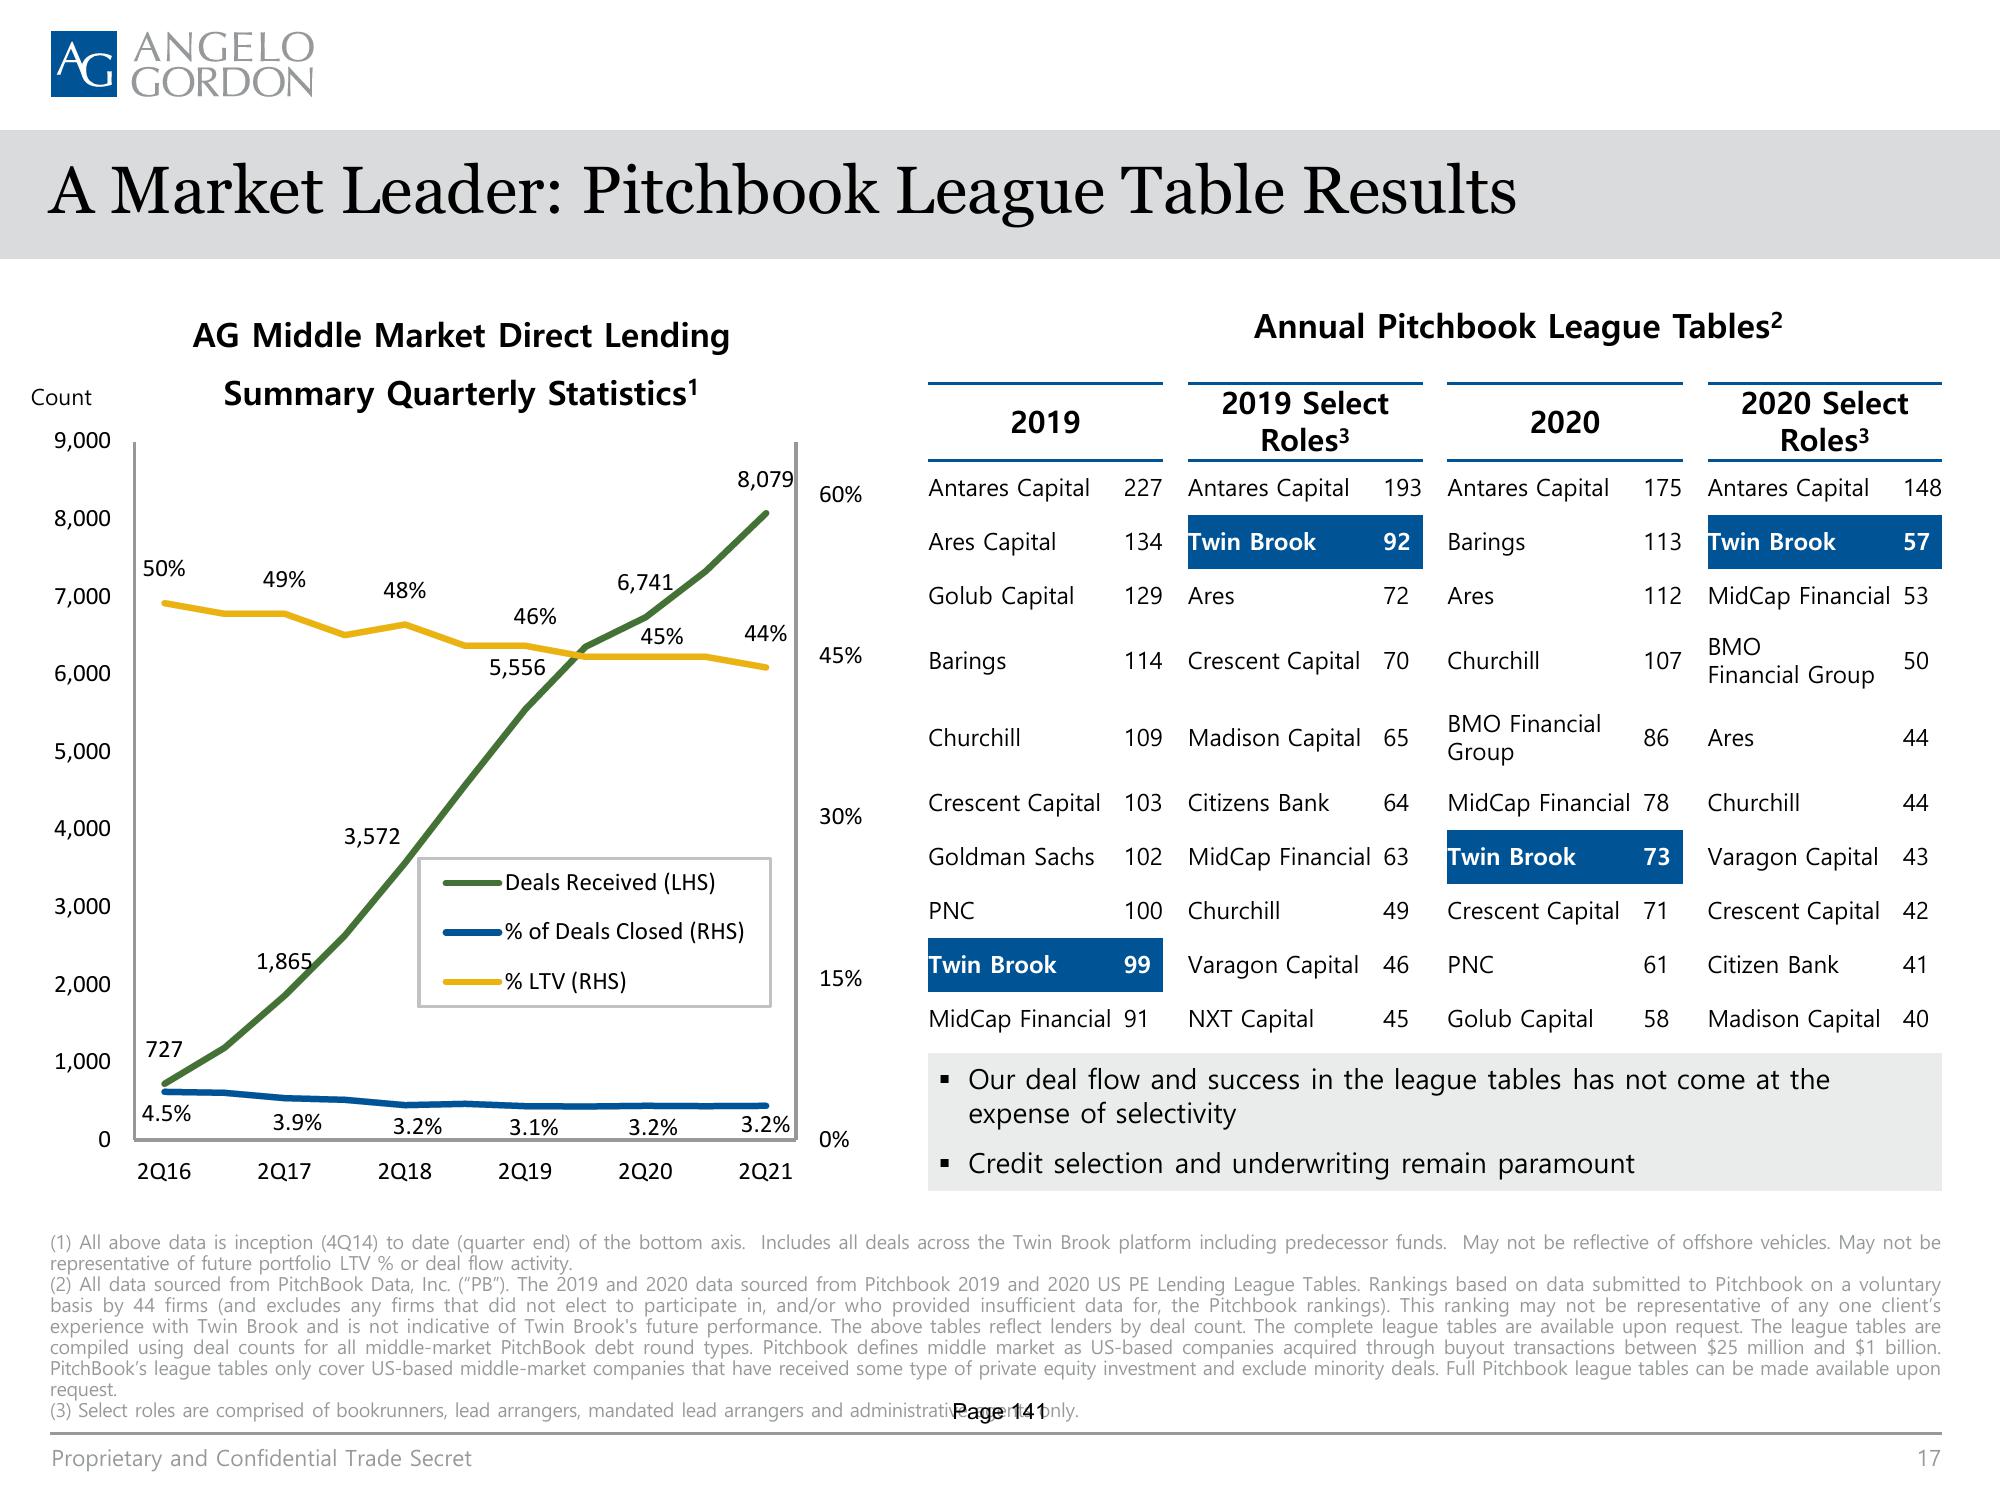
AG Middle Market Direct Lending
Summary Quarterly Statistics¹
2Q16
49%
1,865
3.9%
2017
48%
3,572
3.2%
2Q18
46%
5,556
6,741
3.1%
2Q19
45%
8,079
Deals Received (LHS)
% of Deals Closed (RHS)
% LTV (RHS)
3.2%
2Q20
44%
3.2%
2Q21
60%
45%
30%
15%
0%
Antares Capital
Ares Capital
Golub Capital
Barings
2019
Churchill
PNC
227
134
Twin Brook
129 Ares
Crescent Capital 103
Goldman Sachs 102
100
Annual Pitchbook League Tables²
2019 Select
Roles³
Antares Capital 193 Antares Capital
Twin Brook
92
Barings
Ares
72
114 Crescent Capital 70
109 Madison Capital 65
Citizens Bank 64
MidCap Financial 63
Churchill
49
Varagon Capital 46
NXT Capital 45
2020
Churchill
PNC
2020 Select
Roles³
Antares Capital 148
113
57
112 MidCap Financial 53
BMO
Financial Group
175
BMO Financial
Group
Mid Cap Financial 78
Twin Brook
Crescent Capital 71
61
58
Golub Capital
107
86
73
Twin Brook
Ares
99
Mid Cap Financial 91
▪ Our deal flow and success in the league tables has not come at the
expense of selectivity
▪ Credit selection and underwriting remain paramount
50
44
Churchill
Varagon Capital 43
Crescent Capital 42
Citizen Bank 41
Madison Capital 40
44
(1) All above data is inception (4Q14) to date (quarter end) of the bottom axis. Includes all deals across the Twin Brook platform including predecessor funds. May not be reflective of offshore vehicles. May not be
representative of future portfolio LTV % or deal flow activity.
(2) All data sourced from PitchBook Data, Inc. ("PB"). The 2019 and 2020 data sourced from Pitchbook 2019 and 2020 US PE Lending League Tables. Rankings based on data submitted to Pitchbook on a voluntary
basis by 44 firms (and excludes any firms that did not elect to participate in, and/or who provided insufficient data for, the Pitchbook rankings). This ranking may not be representative of any one client's
experience with Twin Brook and is not indicative of Twin Brook's future performance. The above tables reflect lenders by deal count. The complete league tables are available upon request. The league tables are
compiled using deal counts for all middle-market PitchBook debt round types. Pitchbook defines middle market as US-based companies acquired through buyout transactions between $25 million and $1 billion.
PitchBook's league tables only cover US-based middle-market companies that have received some type of private equity investment and exclude minority deals. Full Pitchbook league tables can be made available upon
request.
(3) Select roles are comprised of bookrunners, lead arrangers, mandated lead arrangers and administrati Page 14 only.
Proprietary and Confidential Trade Secret
17View entire presentation