Verint SPAC Presentation Deck
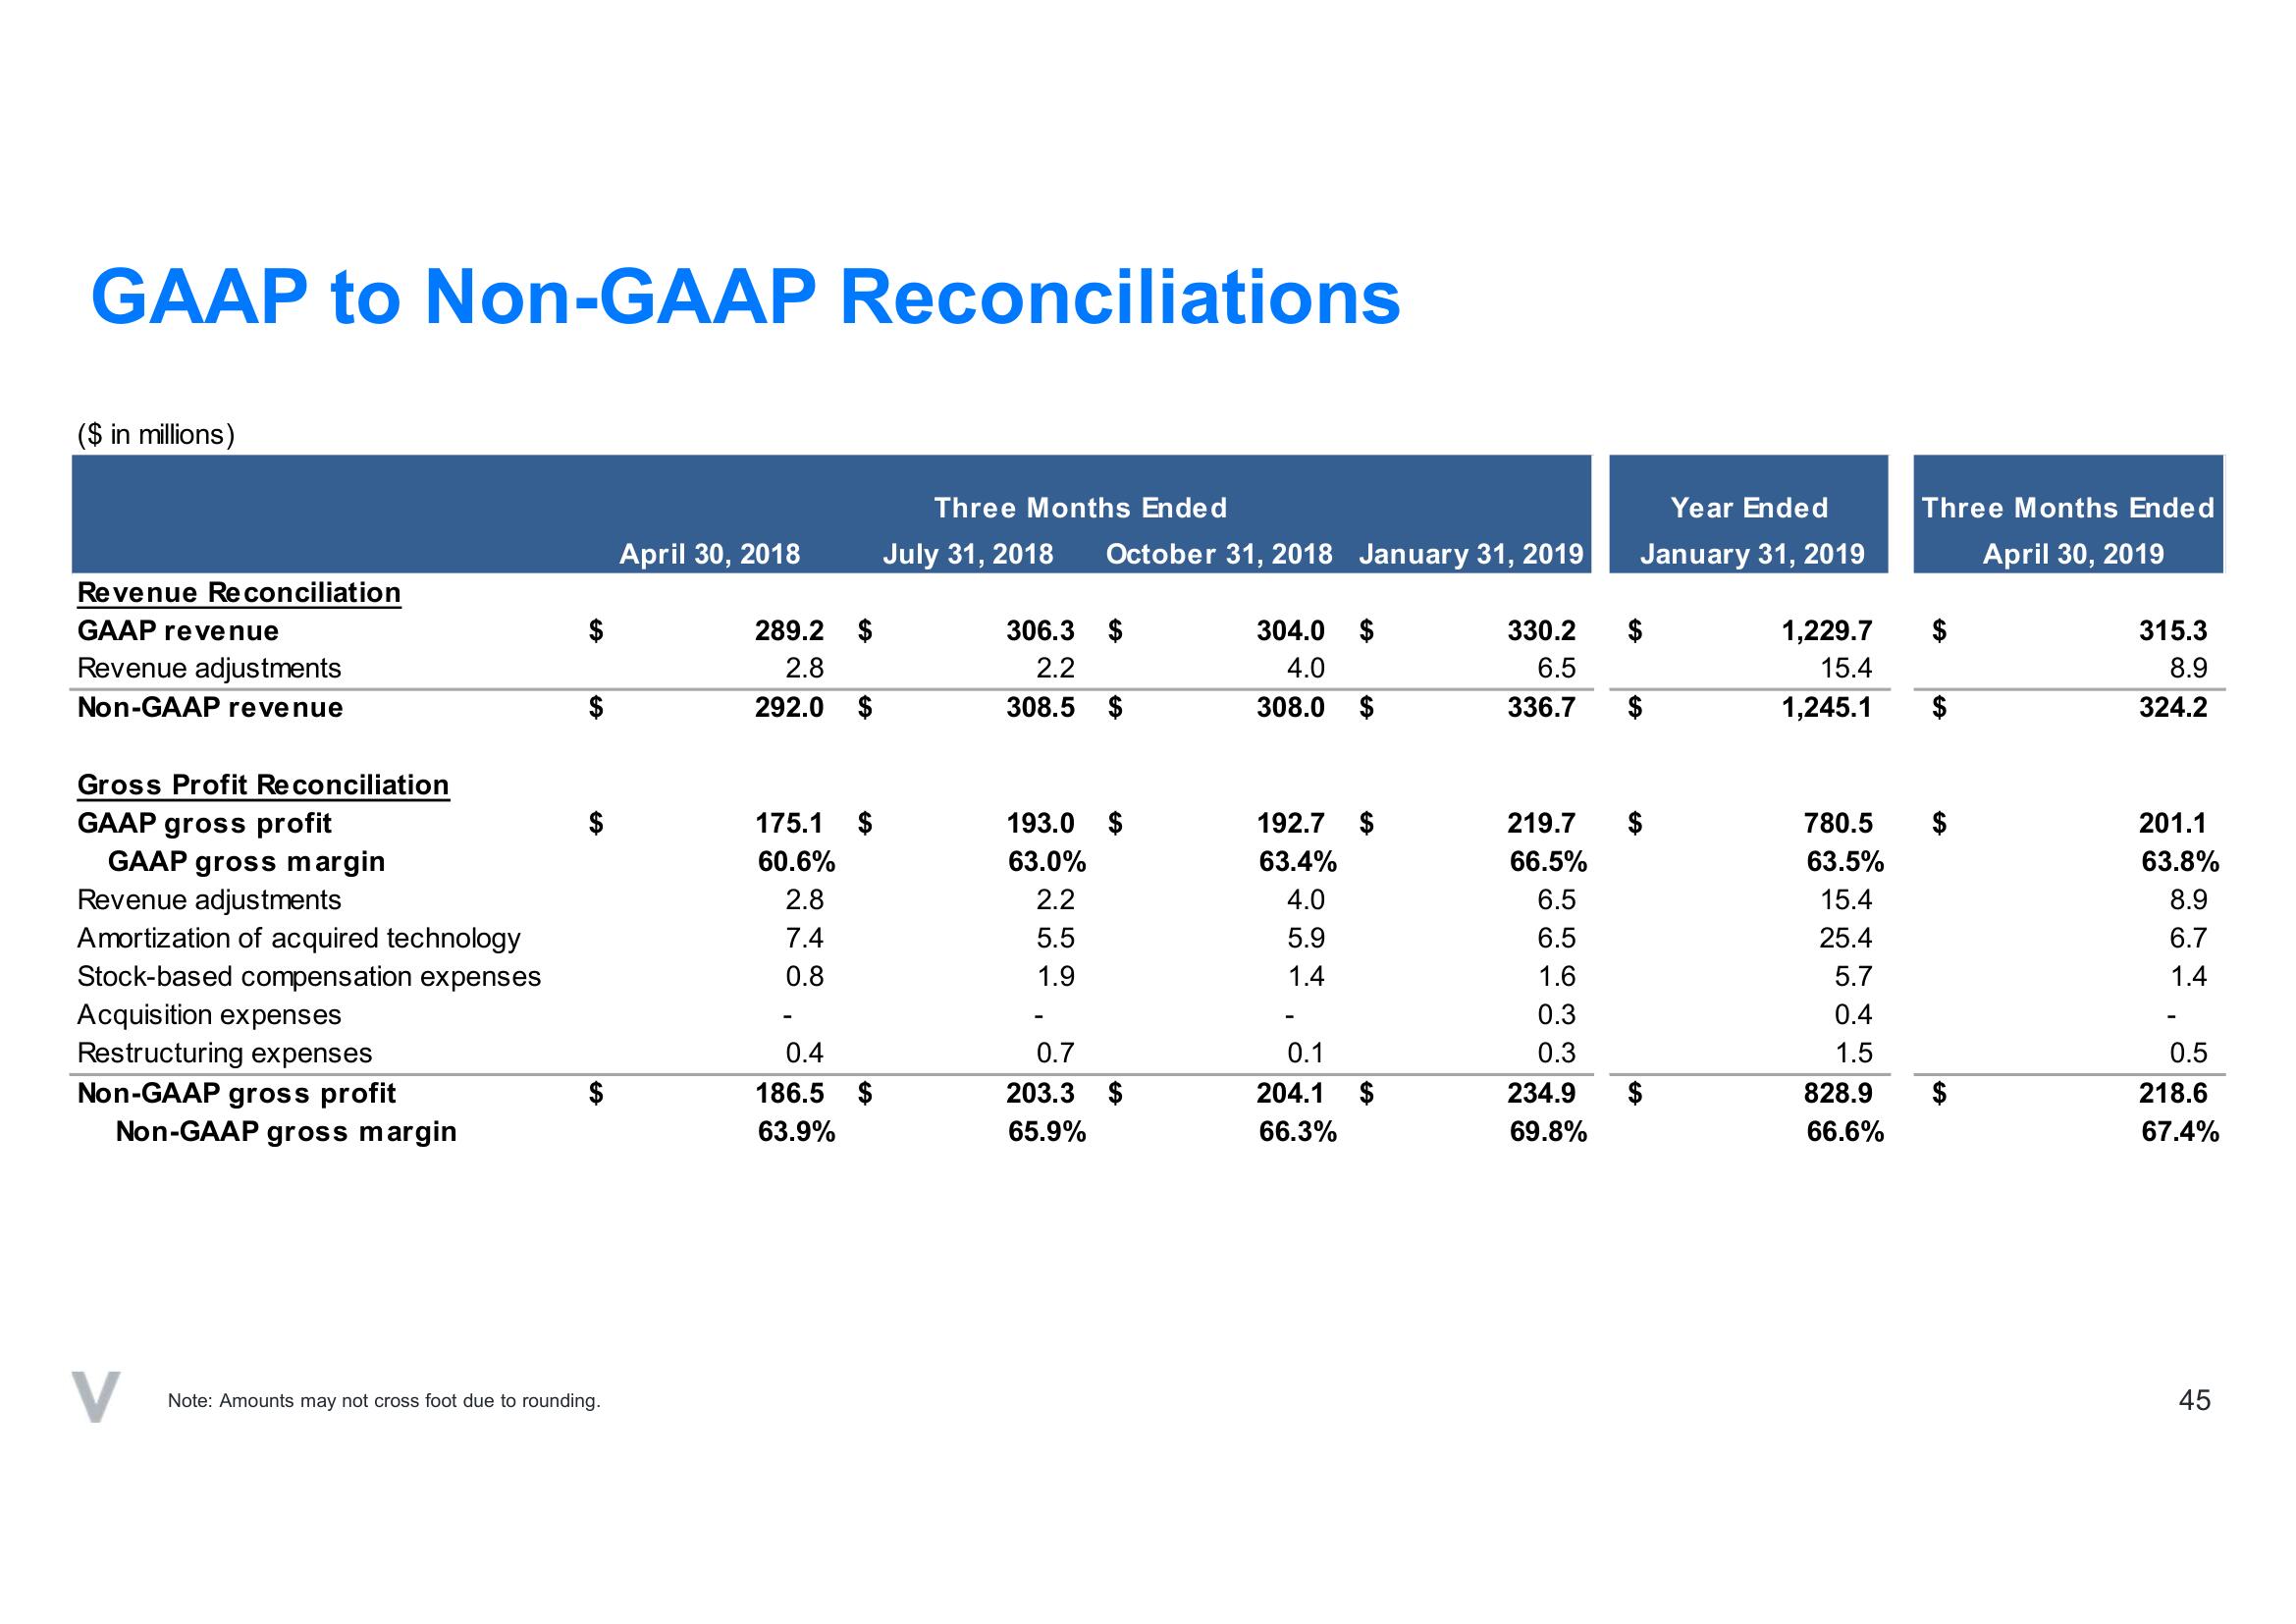
GAAP to Non-GAAP Reconciliations
($ in millions)
Revenue Reconciliation
GAAP revenue
Revenue adjustments
Non-GAAP revenue
Gross Profit Reconciliation
GAAP gross profit
GAAP gross margin
Revenue adjustments
Amortization of acquired technology
Stock-based compensation expenses
Acquisition expenses
Restructuring expenses
Non-GAAP gross profit
Non-GAAP gross margin
V
LA
$
Note: Amounts may not cross foot due to rounding.
April 30, 2018
289.2 $
2.8
292.0 $
175.1
60.6%
2.8
7.4
0.8
0.4
186.5 $
63.9%
Three Months Ended
July 31, 2018 October 31, 2018 January 31, 2019
306.3 $
2.2
308.5 $
193.0 $
63.0%
2.2
5.5
1.9
0.7
203.3 $
65.9%
304.0 $
4.0
308.0 $
192.7
63.4%
4.0
5.9
1.4
0.1
204.1
66.3%
$
330.2
6.5
336.7
219.7
66.5%
6.5
6.5
1.6
0.3
0.3
234.9
69.8%
Year Ended
January 31, 2019
$
1,229.7
15.4
1,245.1
780.5
63.5%
15.4
25.4
5.7
0.4
1.5
828.9
66.6%
Three Months Ended
April 30, 2019
315.3
8.9
324.2
201.1
63.8%
8.9
6.7
1.4
0.5
218.6
67.4%
45View entire presentation