Nexters Results Presentation Deck
Key financial highlights (1/2)
$m
Revenue
Q2 2022
127
LO
HT 2022
5
253
115
Q2 2023
234
HT 2023
Source: Company information
$m
Total comprehensive Income/ Loss
33
Q2 2022
56
H1 2022
21
Q2 2023
12
HT 2023
$m
Adjusted EBITDA
37
Q2 2022
56
H1 2022
17
Q2 2023
LO
5
HT 2023
GDEU
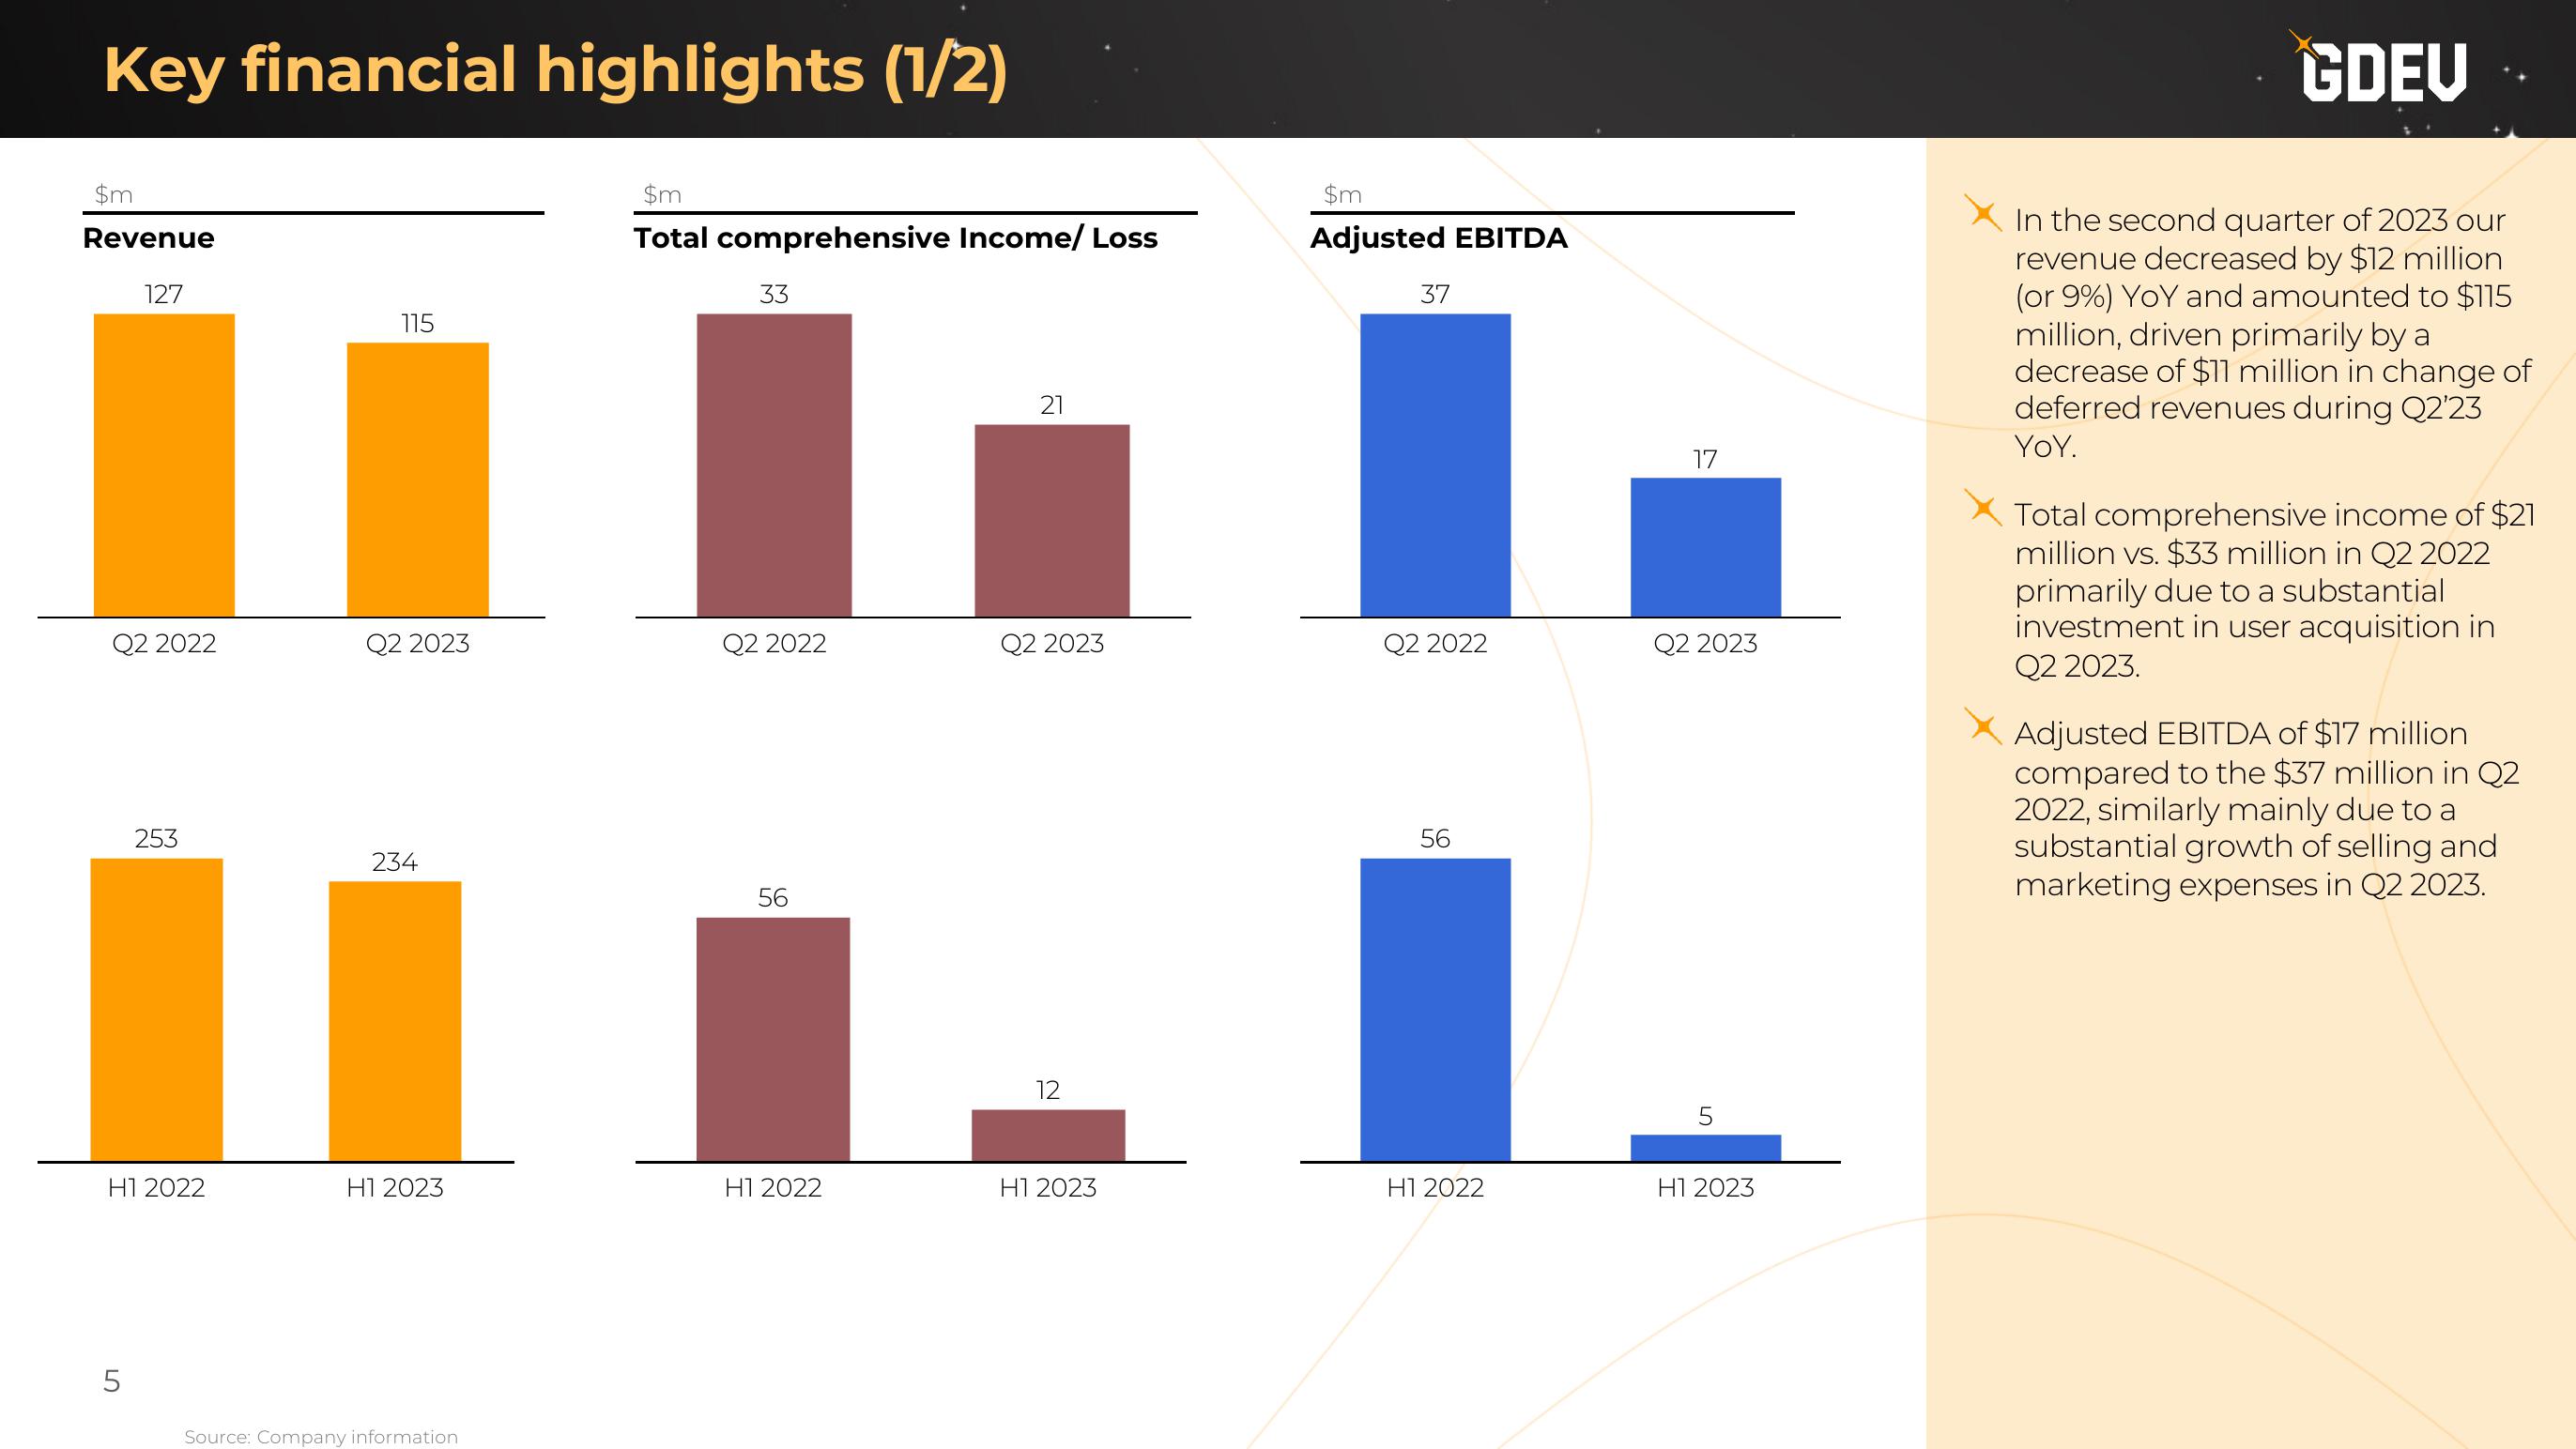
In the second quarter of 2023 our
revenue decreased by $12 million
(or 9%) YOY and amounted to $115
million, driven primarily by a
decrease of $11 million in change of
deferred revenues during Q2'23
YOY.
Total comprehensive income of $21
million vs. $33 million in Q2 2022
primarily due to a substantial
investment in user acquisition in
Q2 2023.
Adjusted EBITDA of $17 million
compared to the $37 million in Q2
2022, similarly mainly due to a
substantial growth of selling and
marketing expenses in Q2 2023.View entire presentation