Snap Inc Results Presentation Deck
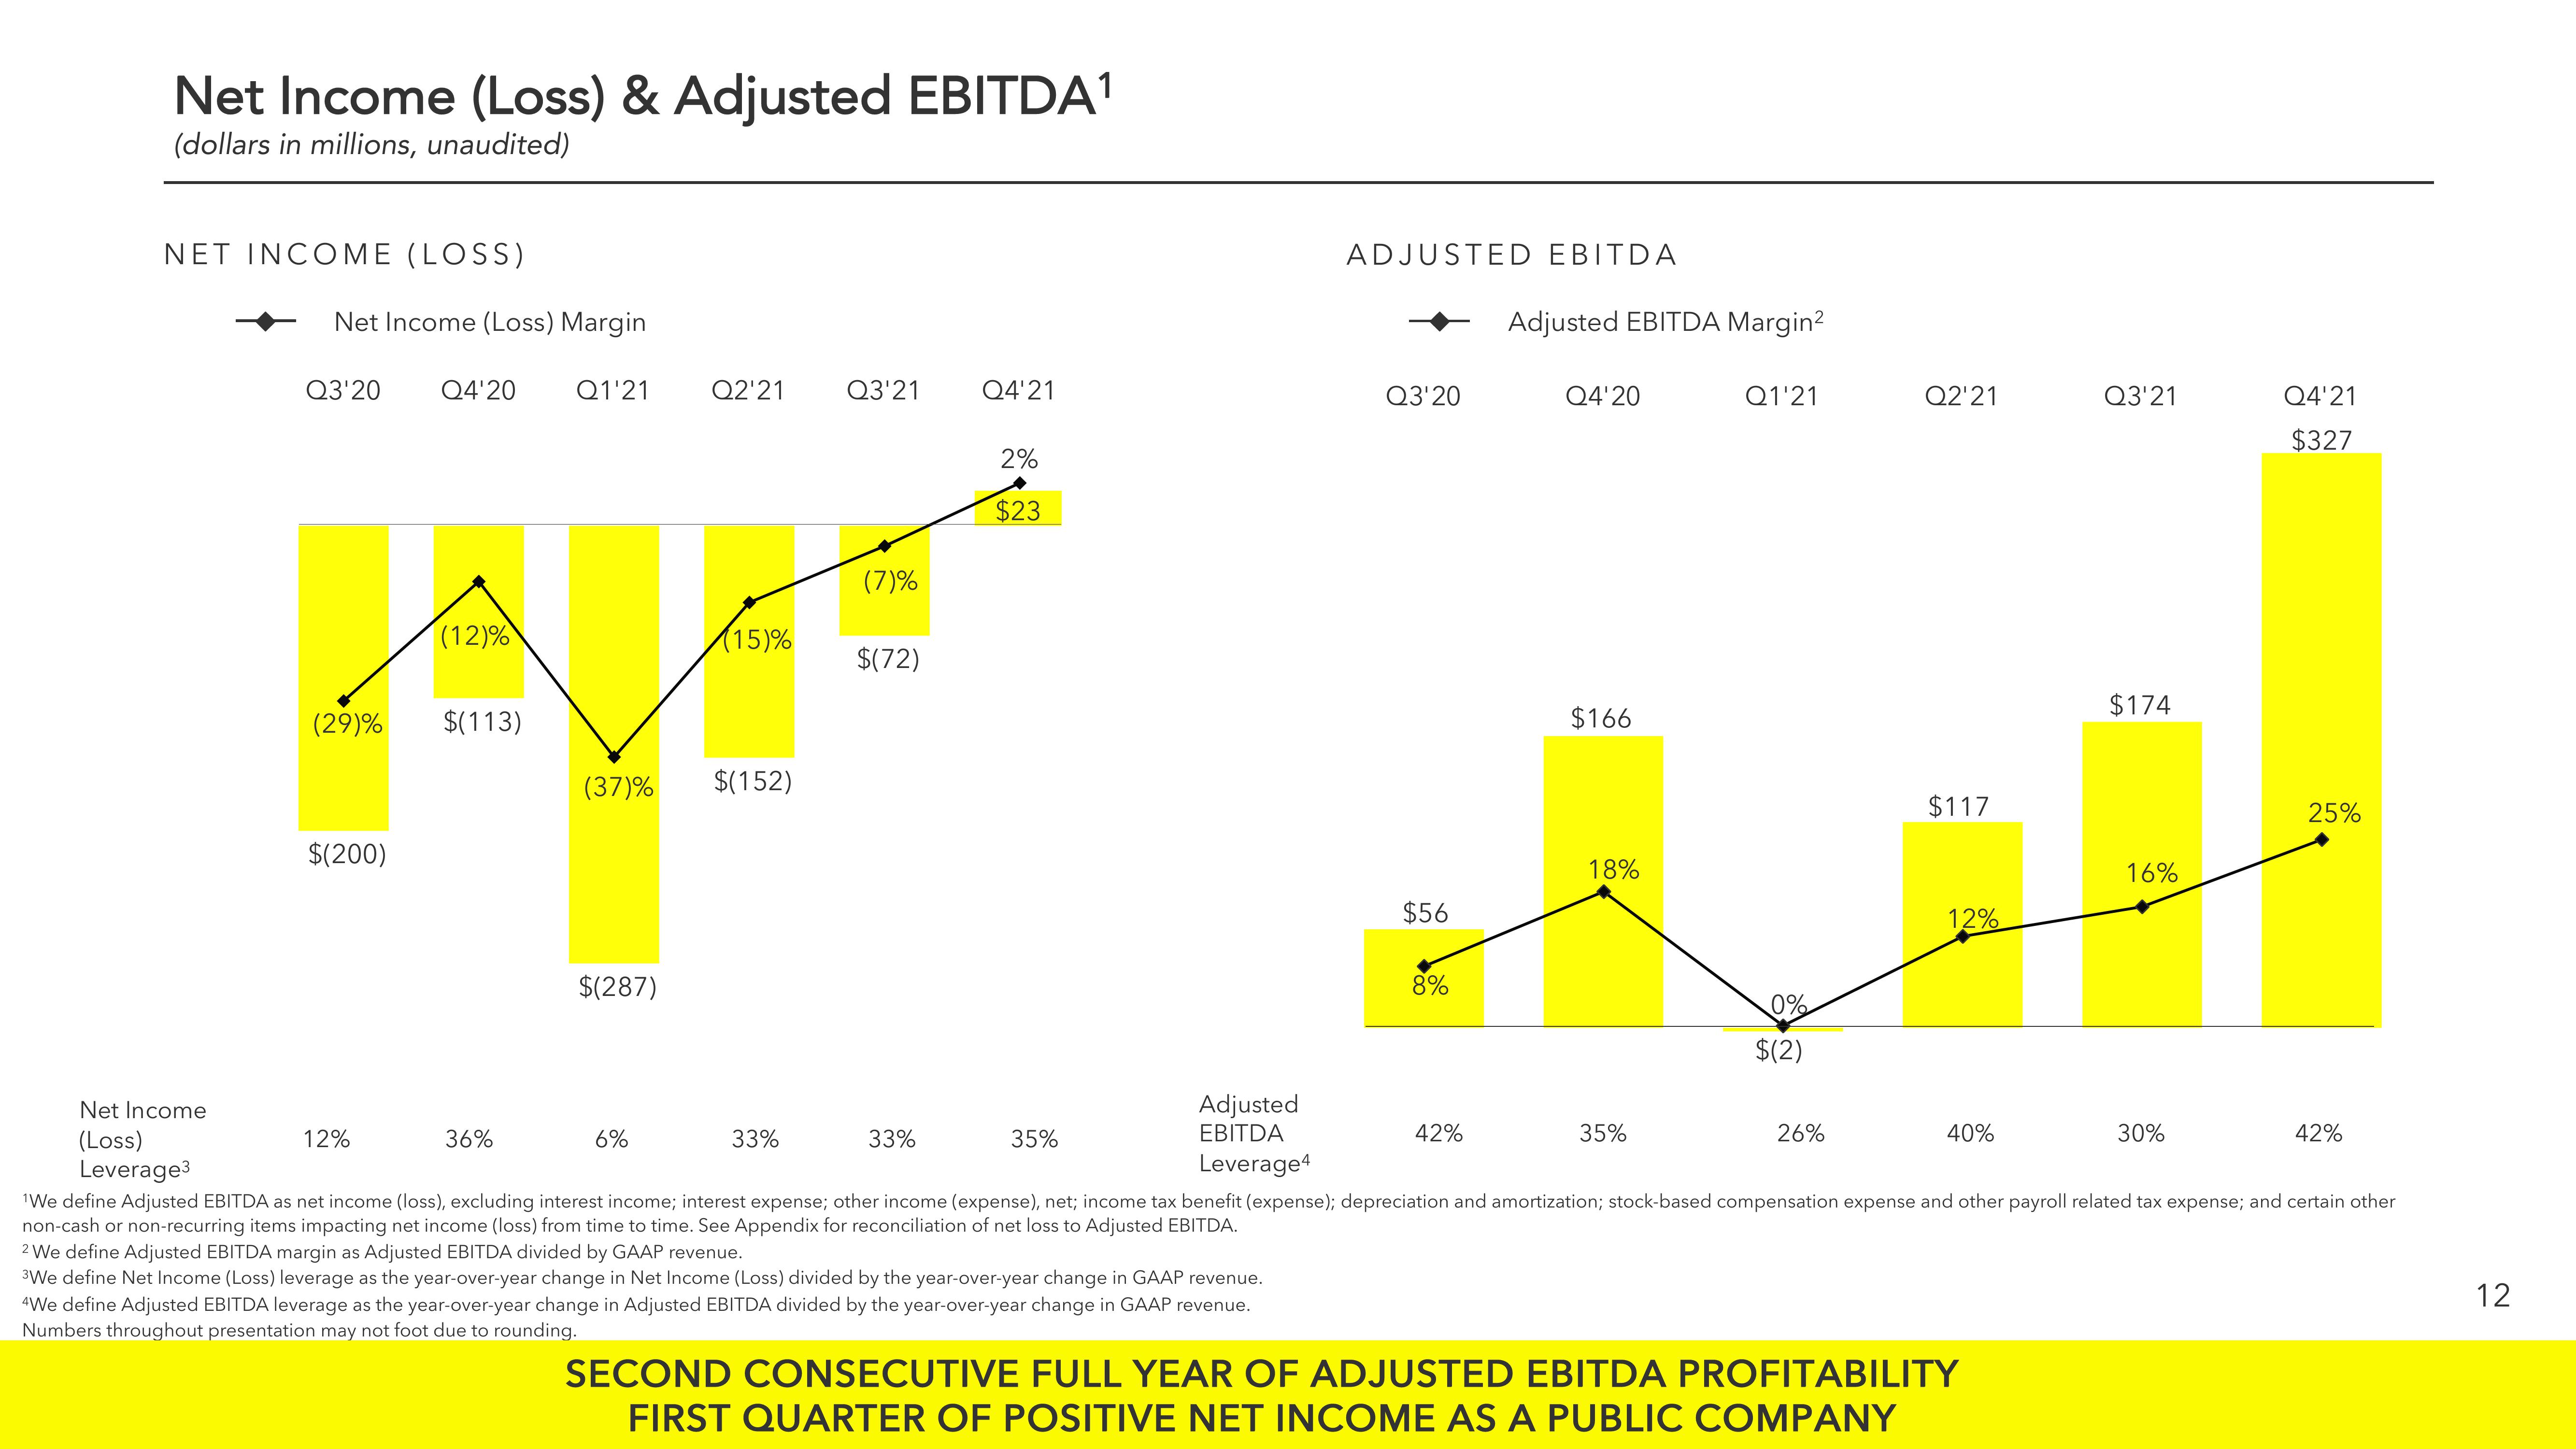
Net Income (Loss) & Adjusted EBITDA¹
(dollars in millions, unaudited)
NET INCOME (LOSS)
Net Income (Loss) Margin
Q3'20
(29)%
$(200)
Q4'20
12%
(12)%
$(113)
Q1'21
36%
$(287)
Q2'21
(37)% $(152)
(15)%
6%
Q3'21
33%
(7)%
$(72)
Q4'21
33%
2%
$23
Adjusted
EBITDA
Leverage4
35%
ADJUSTED EBITDA
Q3'20
$56
8%
Adjusted EBITDA Margin²
42%
Q4'20
$166
18%
Q1'21
35%
0%
$(2)
Net Income
(Loss)
Leverage3
'We define Adjusted EBITDA as net income (loss), excluding interest income; interest expense; other income (expense), net; income tax benefit (expense); depreciation and amortization; stock-based compensation expense and other payroll related tax expense; and certain other
non-cash or non-recurring items impacting net income (loss) from time to time. See Appendix for reconciliation of net loss to Adjusted EBITDA.
2We define Adjusted EBITDA margin as Adjusted EBITDA divided by GAAP revenue.
³We define Net Income (Loss) leverage as the year-over-year change in Net Income (Loss) divided by the year-over-year change in GAAP revenue.
4We define Adjusted EBITDA leverage as the year-over-year change in Adjusted EBITDA divided by the year-over-year change in GAAP revenue.
Numbers throughout presentation may not foot due to rounding.
Q2'21
26%
$117
12%
40%
Q3'21
SECOND CONSECUTIVE FULL YEAR OF ADJUSTED EBITDA PROFITABILITY
FIRST QUARTER OF POSITIVE NET INCOME AS A PUBLIC COMPANY
$174
16%
Q4'21
$327
30%
25%
42%
12View entire presentation