Zegna Results Presentation Deck
GROUP REVENUES BY CHANNEL Ormenegildo Ermenegildo Zegna Group
(UNAUDITED)
(E thousands, except
percentages)
Revenues
Direct to Consumer
(DTC) - Zegna
branded products
Direct to Consumer
(DTC)- Thom Browne
branded products
Total Direct to
Consumer (DTC)
Wholesale Zegna
branded products
Wholesale Thom
Browne branded
products
Wholesale Third Party
Brands and Textile
Total Wholesale
Other
(1)
FY 2022
% on
Preliminary Revenues
Unaudited
1,492,840
772,505
145,702
918,207
151,437
184,312
234,561
570,310
4,323
100 %
62%
38 %
%
FY 2021
1,292,402
712,862
138,567
851,429
134,449
124,830
177,201
436,480
4,493
% on
Revenues
100%
66%
34%
-%
A% vs FY
2021
15.5%
8.4%
5.1%
7.8%
12.6%
47.7%
32.4%
30.7%
n.m.
A% vs FY
2021 at
constant
currency
11.0%
2.9%
(1.5%)
2.2%
10.6%
46.6%
32.2%
29.4%
n.m.
% on
4Q 2022
Preliminary Revenues
Unaudited
406,973
230,277
42,983
273,260
44,097
32,685
55,701
132,483
1,230
100%
67%
33%
-%
4Q 2021
Unaudited
409,074
245,416
47,778
293,194
36,536
20,123
57,445
114,104
1,776
% on
Revenues
100%
72%
28%
-%
A% vs 4Q
2021
(0.5%)
(6.2%)
(10.0%)
(6.8%)
20.7%
62.4%
(3.0%)
16.1%
n.m.
A% vs Q4
2021 at
constant
currency
(2.9%)
(8.6%)
(12.5%)
(9.2%)
18.7%
60.2%
(4.7%)
14.3%
n.m.
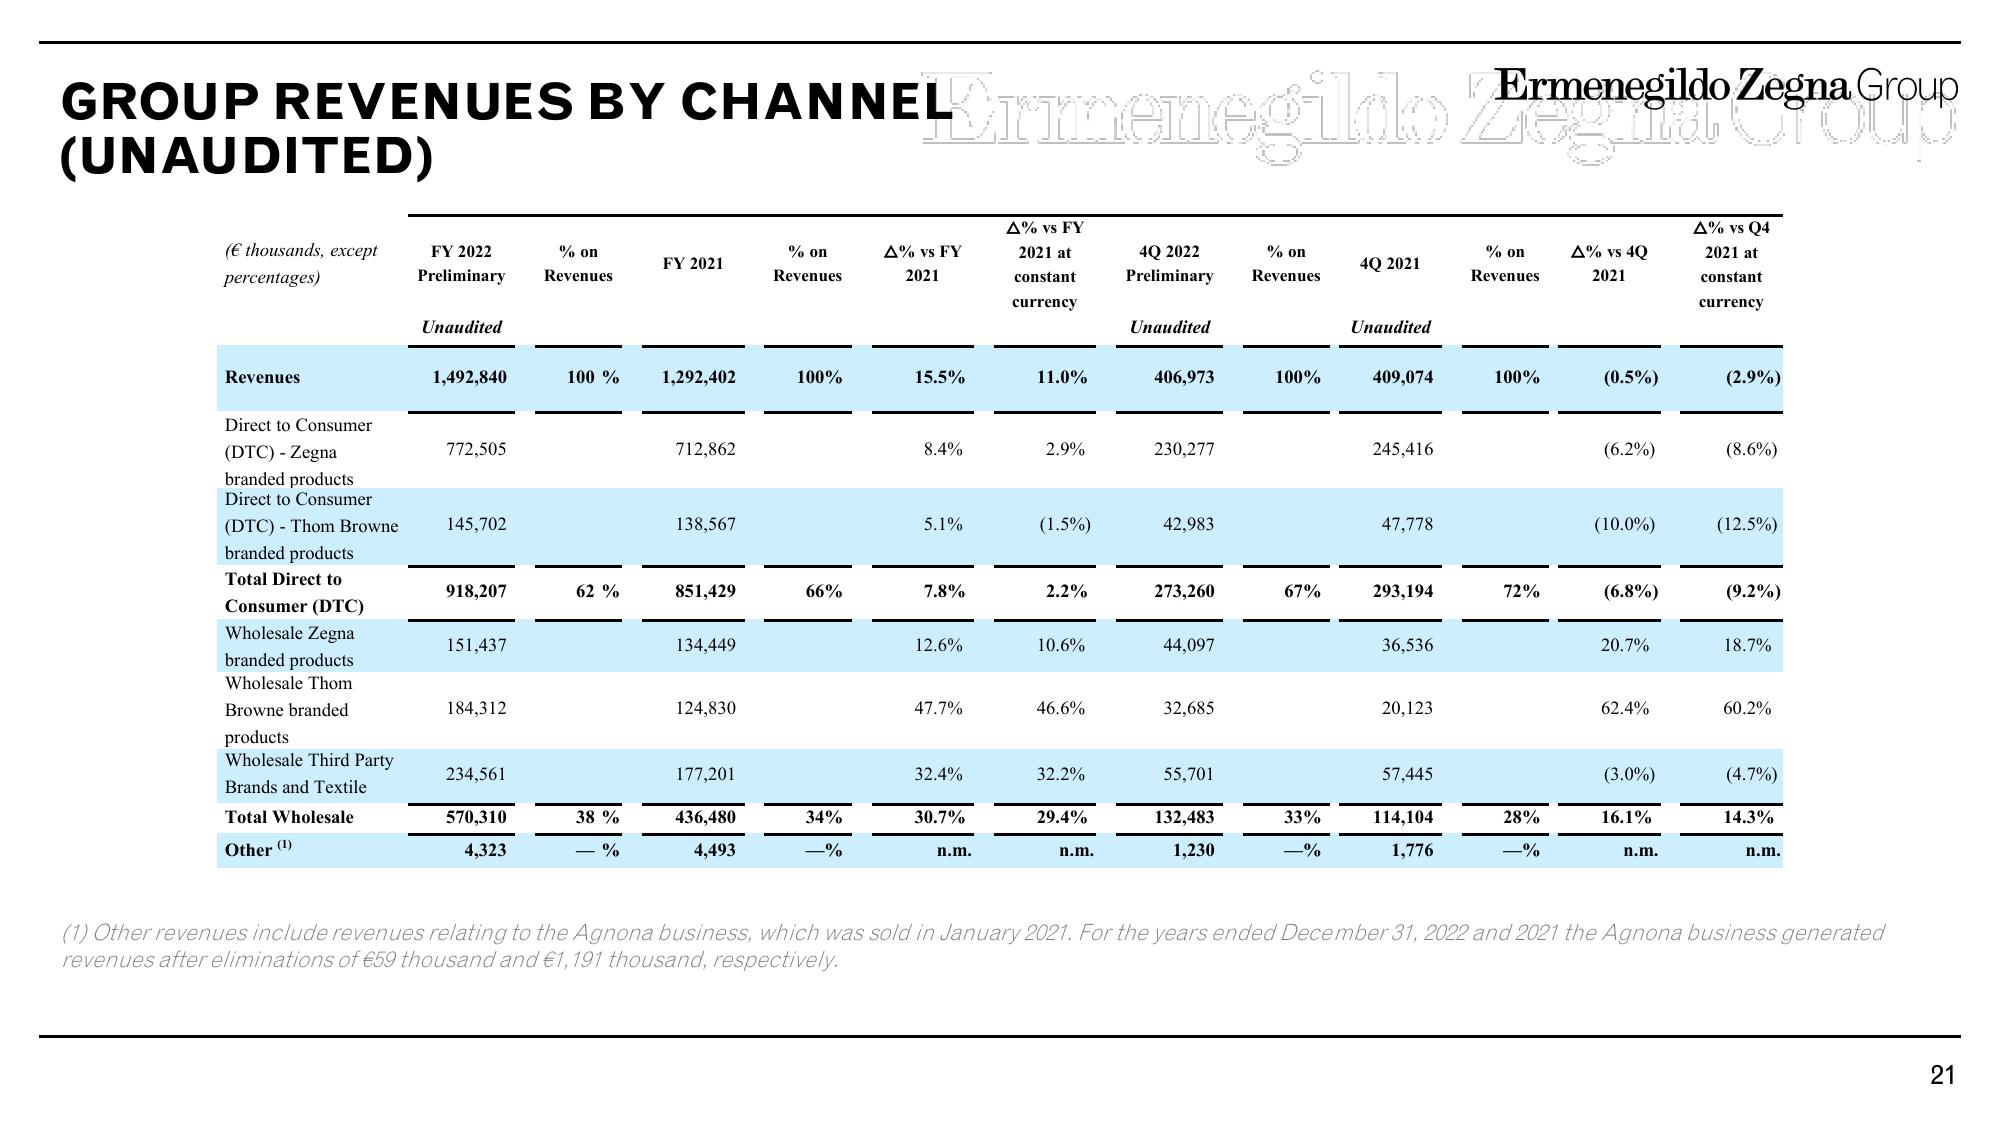
(1) Other revenues include revenues relating to the Agnona business, which was sold in January 2021. For the years ended December 31, 2022 and 2021 the Agnona business generated
revenues after eliminations of €59 thousand and €1,191 thousand, respectively.
21View entire presentation