DraftKings Investor Day Presentation Deck
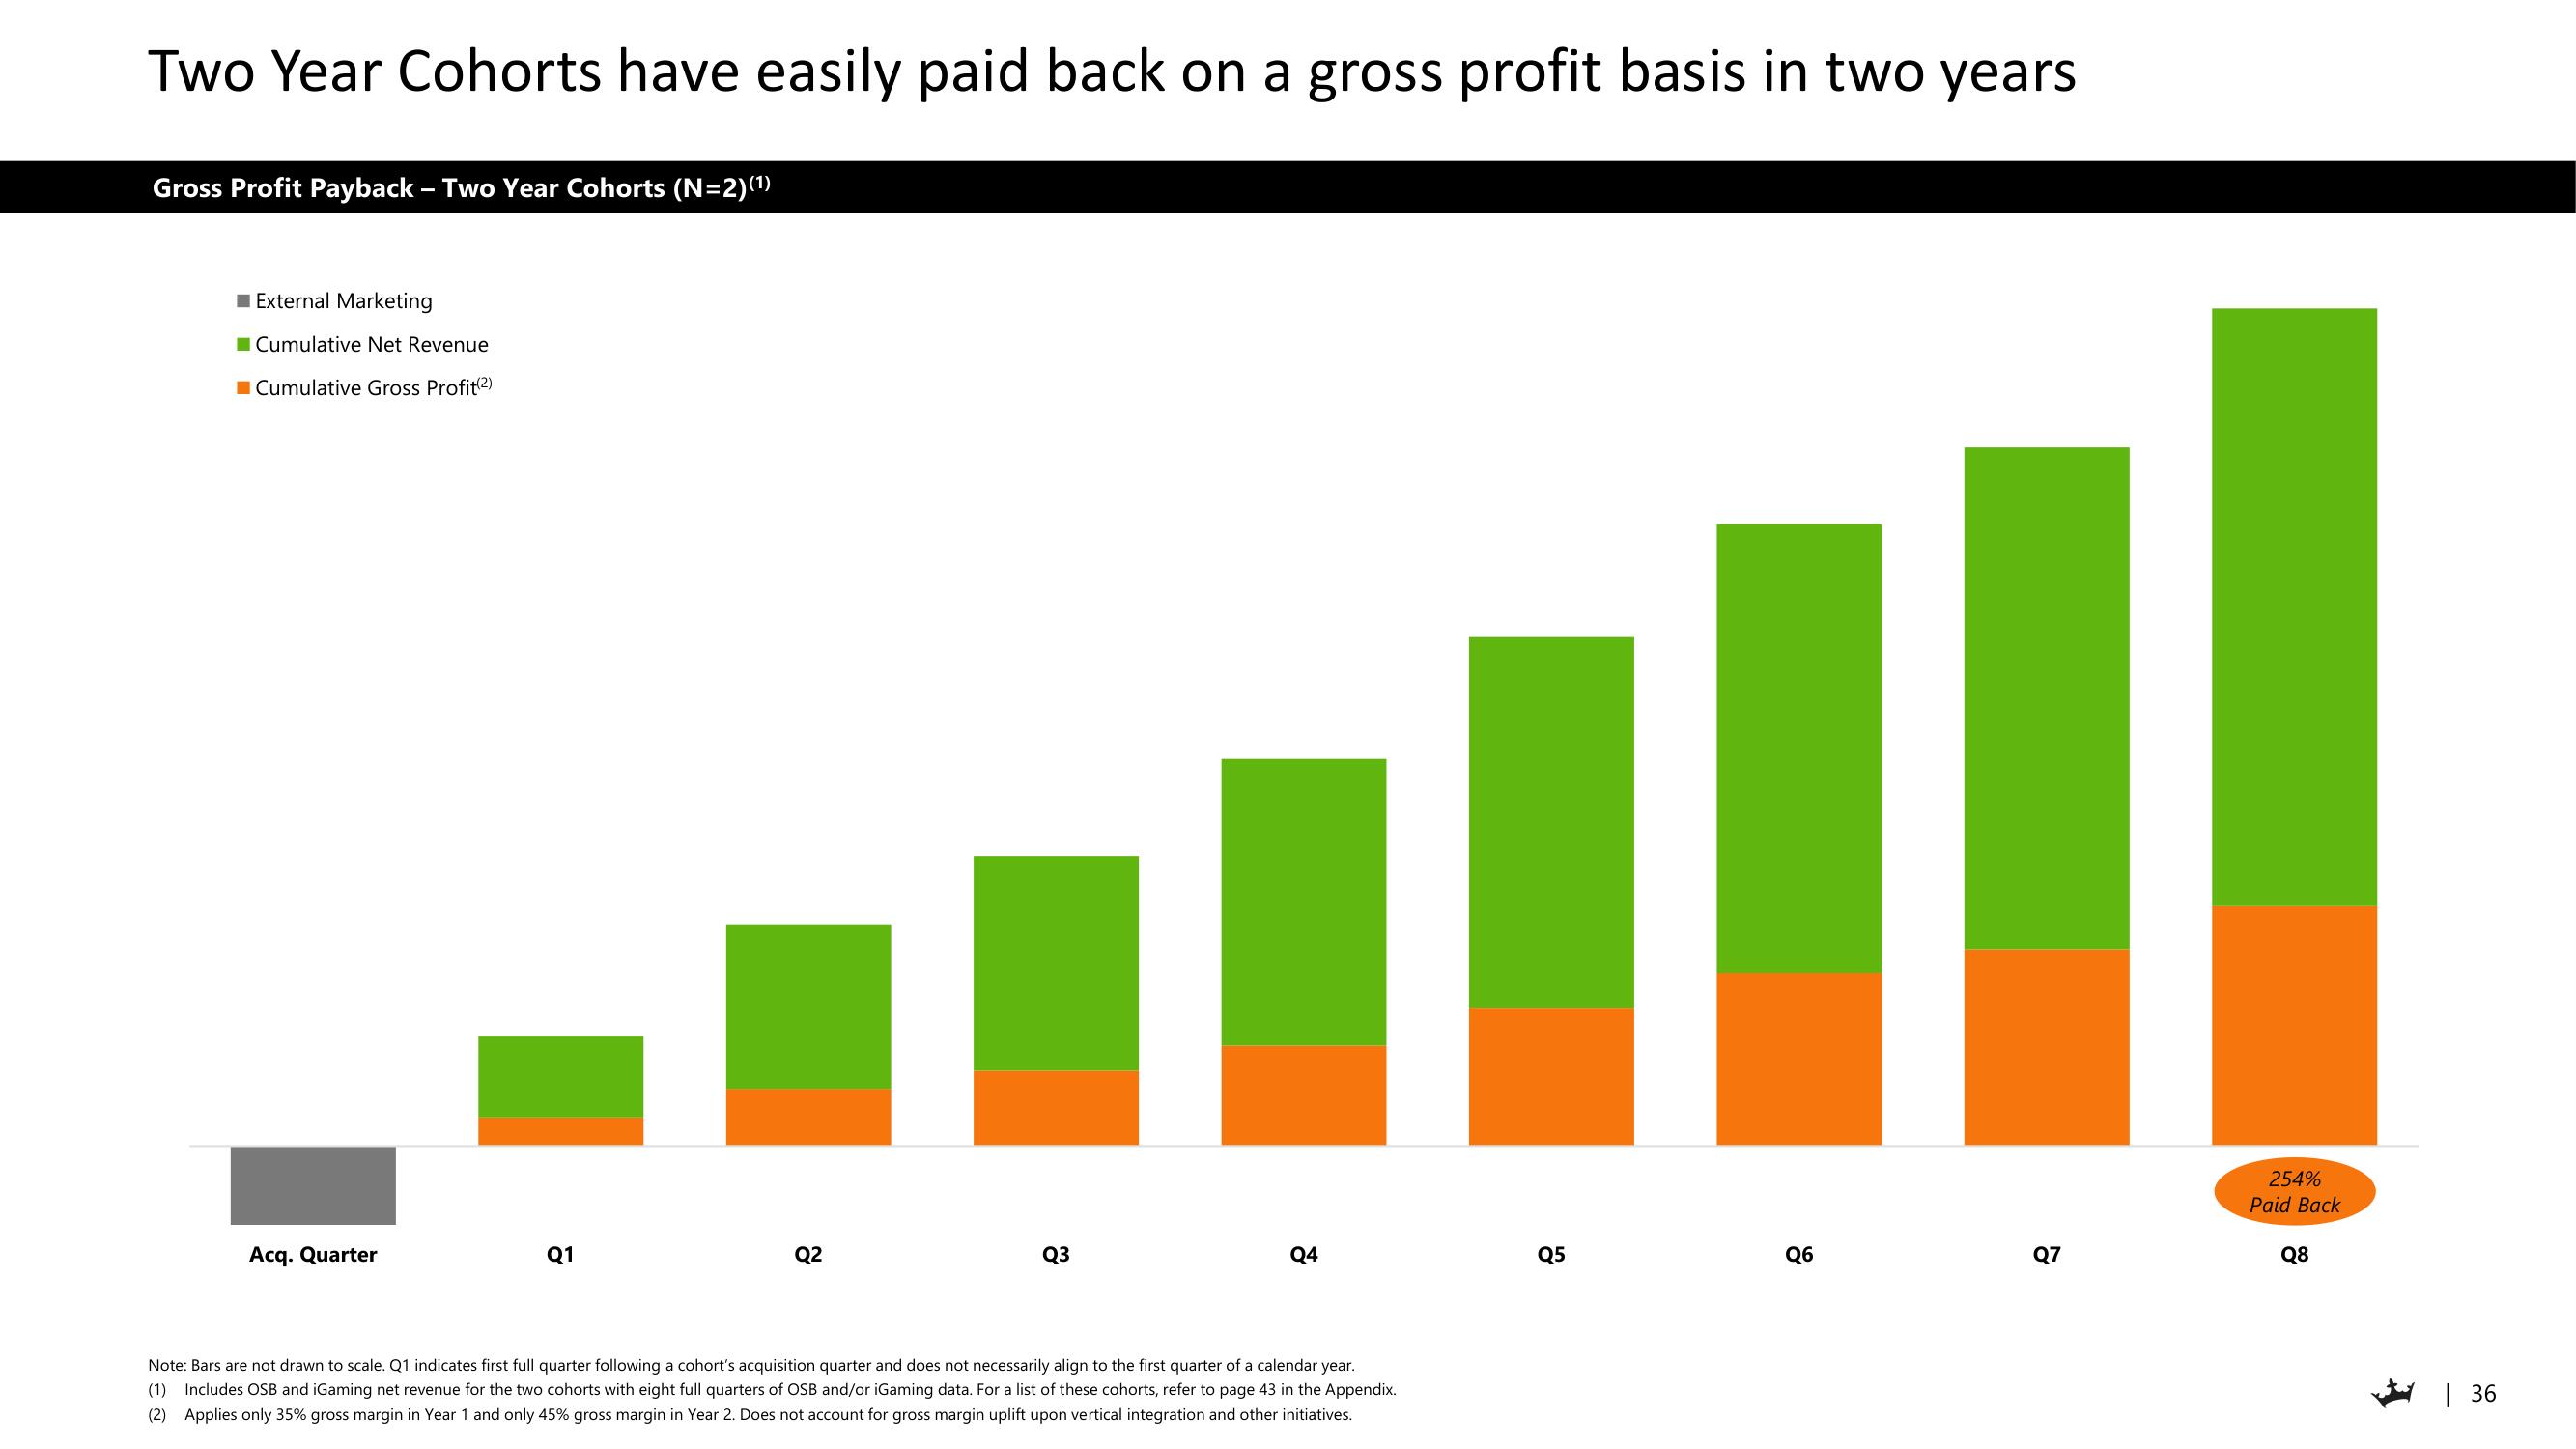
Two Year Cohorts have easily paid back on a gross profit basis in two years
Gross Profit Payback - Two Year Cohorts (N=2)(¹)
External Marketing
Cumulative Net Revenue
Cumulative Gross Profit (2)
Acq. Quarter
Q1
Q2
Q3
Q4
Note: Bars are not drawn to scale. Q1 indicates first full quarter following a cohort's acquisition quarter and does not necessarily align to the first quarter of a calendar year.
(1) Includes OSB and iGaming net revenue for the two cohorts with eight full quarters of OSB and/or iGaming data. For a list of these cohorts, refer to page 43 in the Appendix.
(2) Applies only 35% gross margin in Year 1 and only 45% gross margin in Year 2. Does not account for gross margin uplift upon vertical integration and other initiatives.
Q5
Q6
Q7
254%
Paid Back
Q8
| 36View entire presentation