Yelp Results Presentation Deck
($mm)
Net Income (Loss)
+ Tax & Other Expenses
+ Depreciation &
Amortization
+ Stock Based
Compensation*
+ Restructuring &
Integration
Adjusted EBITDA
/ Net Revenue
2012
0.3
($19.1) ($10.1)
7.2
14.9
1.3
$4.6
$137.6
Adjusted EBITDA reconciliation
2013
3.3%
1.2
11.5
26.1
0.7
$29.4
$233.0
2014
12.6%
$36.5 ($32.9)
(25.4)
17.6
42.3
0.0
$70.9
$377.5
2015
18.8%
11.6
29.6
60.8
0.0
$69.1
$549.7
2016
12.6%
($4.7)
(0.3)
35.3
86.3
3.5
$120.1
$713.1
Q1
16.8%
($15.4)
1.2
8.2
19.1
0.0
$13.0
$158.6
8.2%
2016
Q2
$0.4
(1.6)
8.6
20.7
0.0
$28.1
$173.4
Q3
16.2%
$2.1
(0.1)
9.2
22.6
0.0
$33.7
$186.2
Q4
18.1%
$8.3
0.3
9.4
23.9
3.5
$45.3
$194.8
Q1
23.2%
($4.8)
(0.7)
10.2
24.3
0.2
$29.3
$197.3
2017
14.8%
Q2
$7.6
(0.7)
10.7
25.4
0.0
$42.9
Adjusted
EBITDA Margin
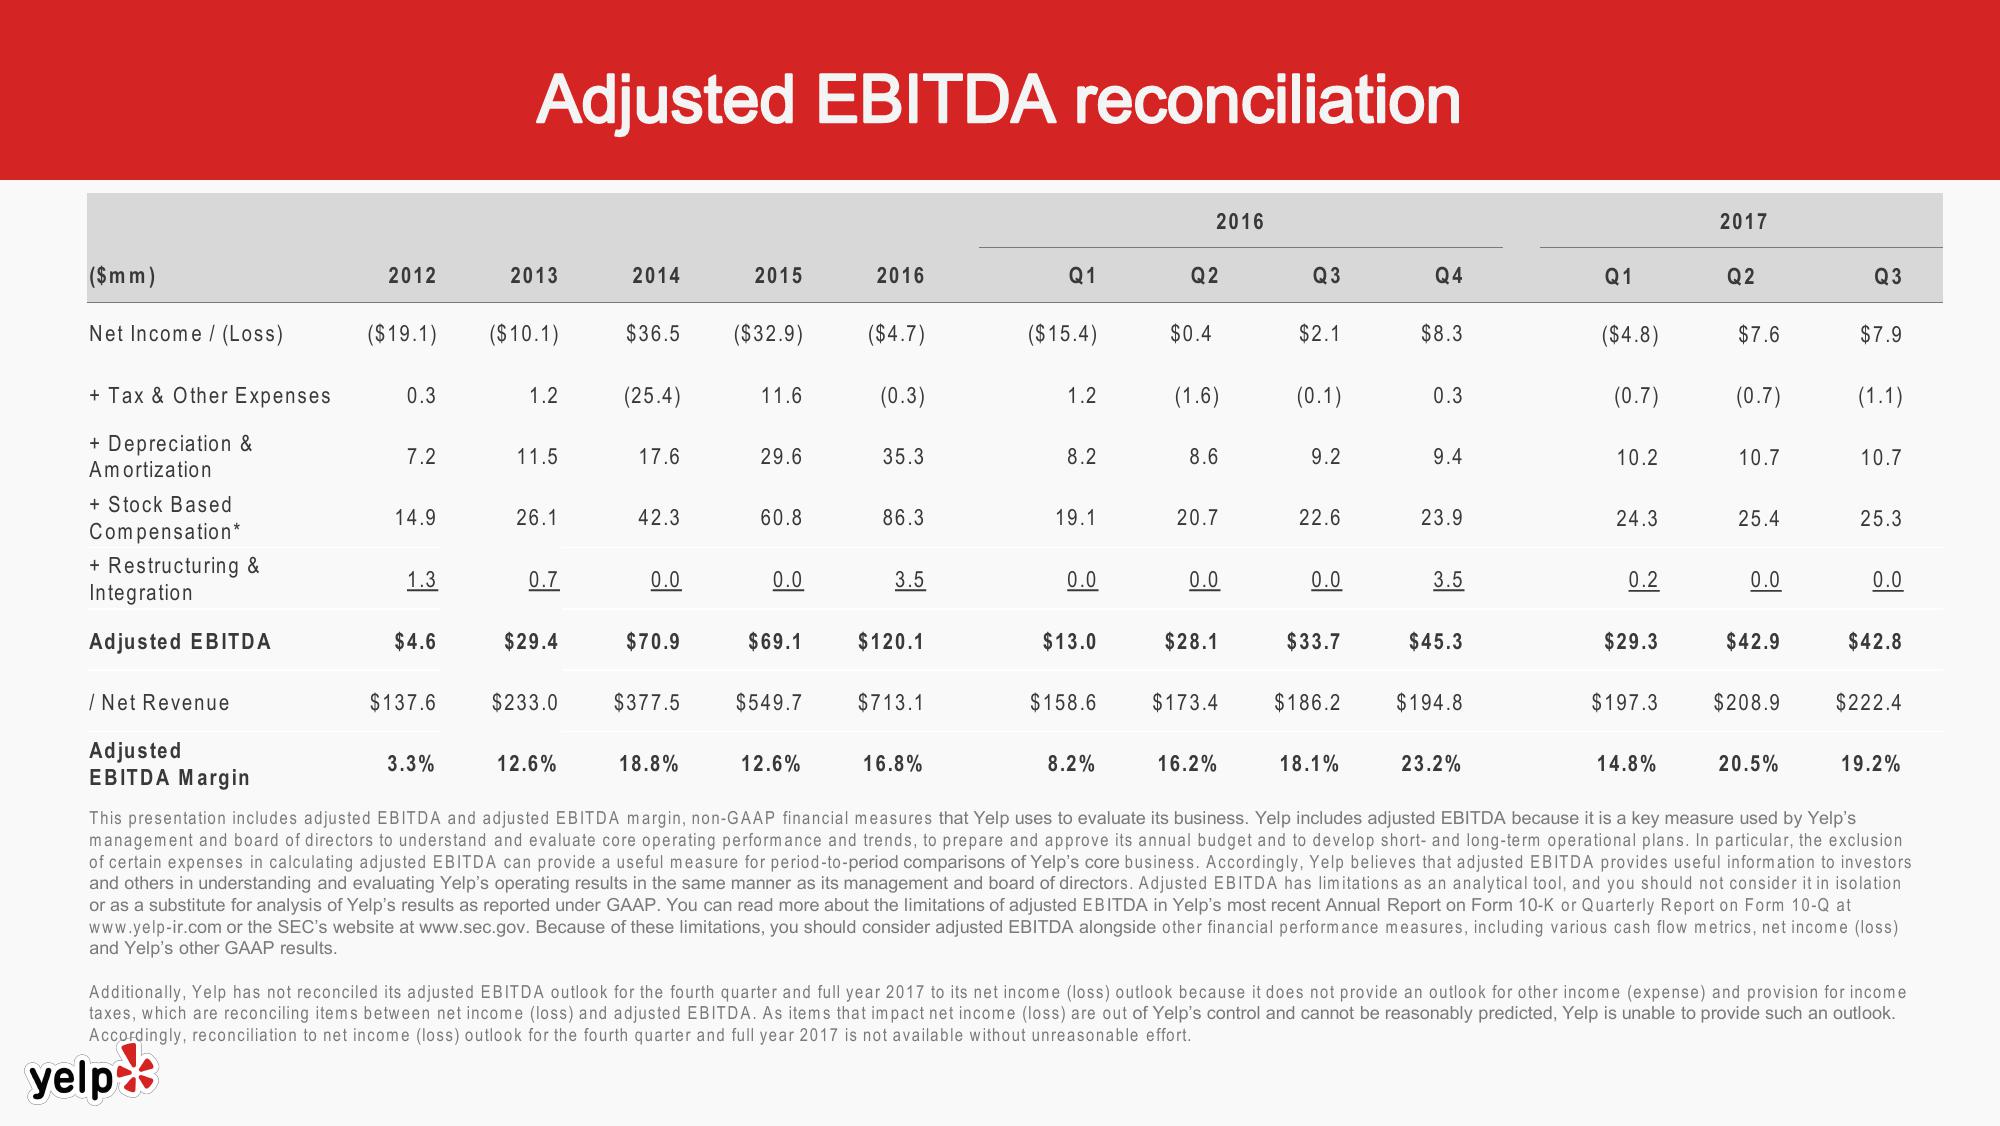
This presentation includes adjusted EBITDA and adjusted EBITDA margin, non-GAAP financial measures that Yelp uses to evaluate its business. Yelp includes adjusted EBITDA because it is a key measure used by Yelp's
management and board of directors to understand and evaluate core operating performance and trends, to prepare and approve its annual budget and to develop short- and long-term operational plans. In particular, the exclusion
of certain expenses in calculating adjusted EBITDA can provide a useful measure for period-to-period comparisons of Yelp's core business. Accordingly, Yelp believes that adjusted EBITDA provides useful information to investors
and others in understanding and evaluating Yelp's operating results in the same manner as its management and board of directors. Adjusted EBITDA has limitations as an analytical tool, and you should not consider it in isolation
or as a substitute for analysis of Yelp's results as reported under GAAP. You can read more about the limitations of adjusted EBITDA in Yelp's most recent Annual Report on Form 10-K or Quarterly Report on Form 10-Q at
www.yelp-ir.com or the SEC's website at www.sec.gov. Because of these limitations, you should consider adjusted EBITDA alongside other financial performance measures, including various cash flow metrics, net income (loss)
and Yelp's other GAAP results.
$208.9
Q3
20.5%
$7.9
(1.1)
10.7
25.3
0.0
$42.8
$222.4
19.2%
Additionally, Yelp has not reconciled its adjusted EBITDA outlook for the fourth quarter and full year 2017 to its net income (loss) outlook because it does not provide an outlook for other income (expense) and provision for income
taxes, which are reconciling items between net income (loss) and adjusted EBITDA. As items that impact net income (loss) are out of Yelp's control and cannot be reasonably predicted, Yelp is unable to provide such an outlook.
Accordingly, reconciliation to net income (loss) outlook for the fourth quarter and full year 2017 is not available without unreasonable effort.
yelp*View entire presentation