Avantor Results Presentation Deck
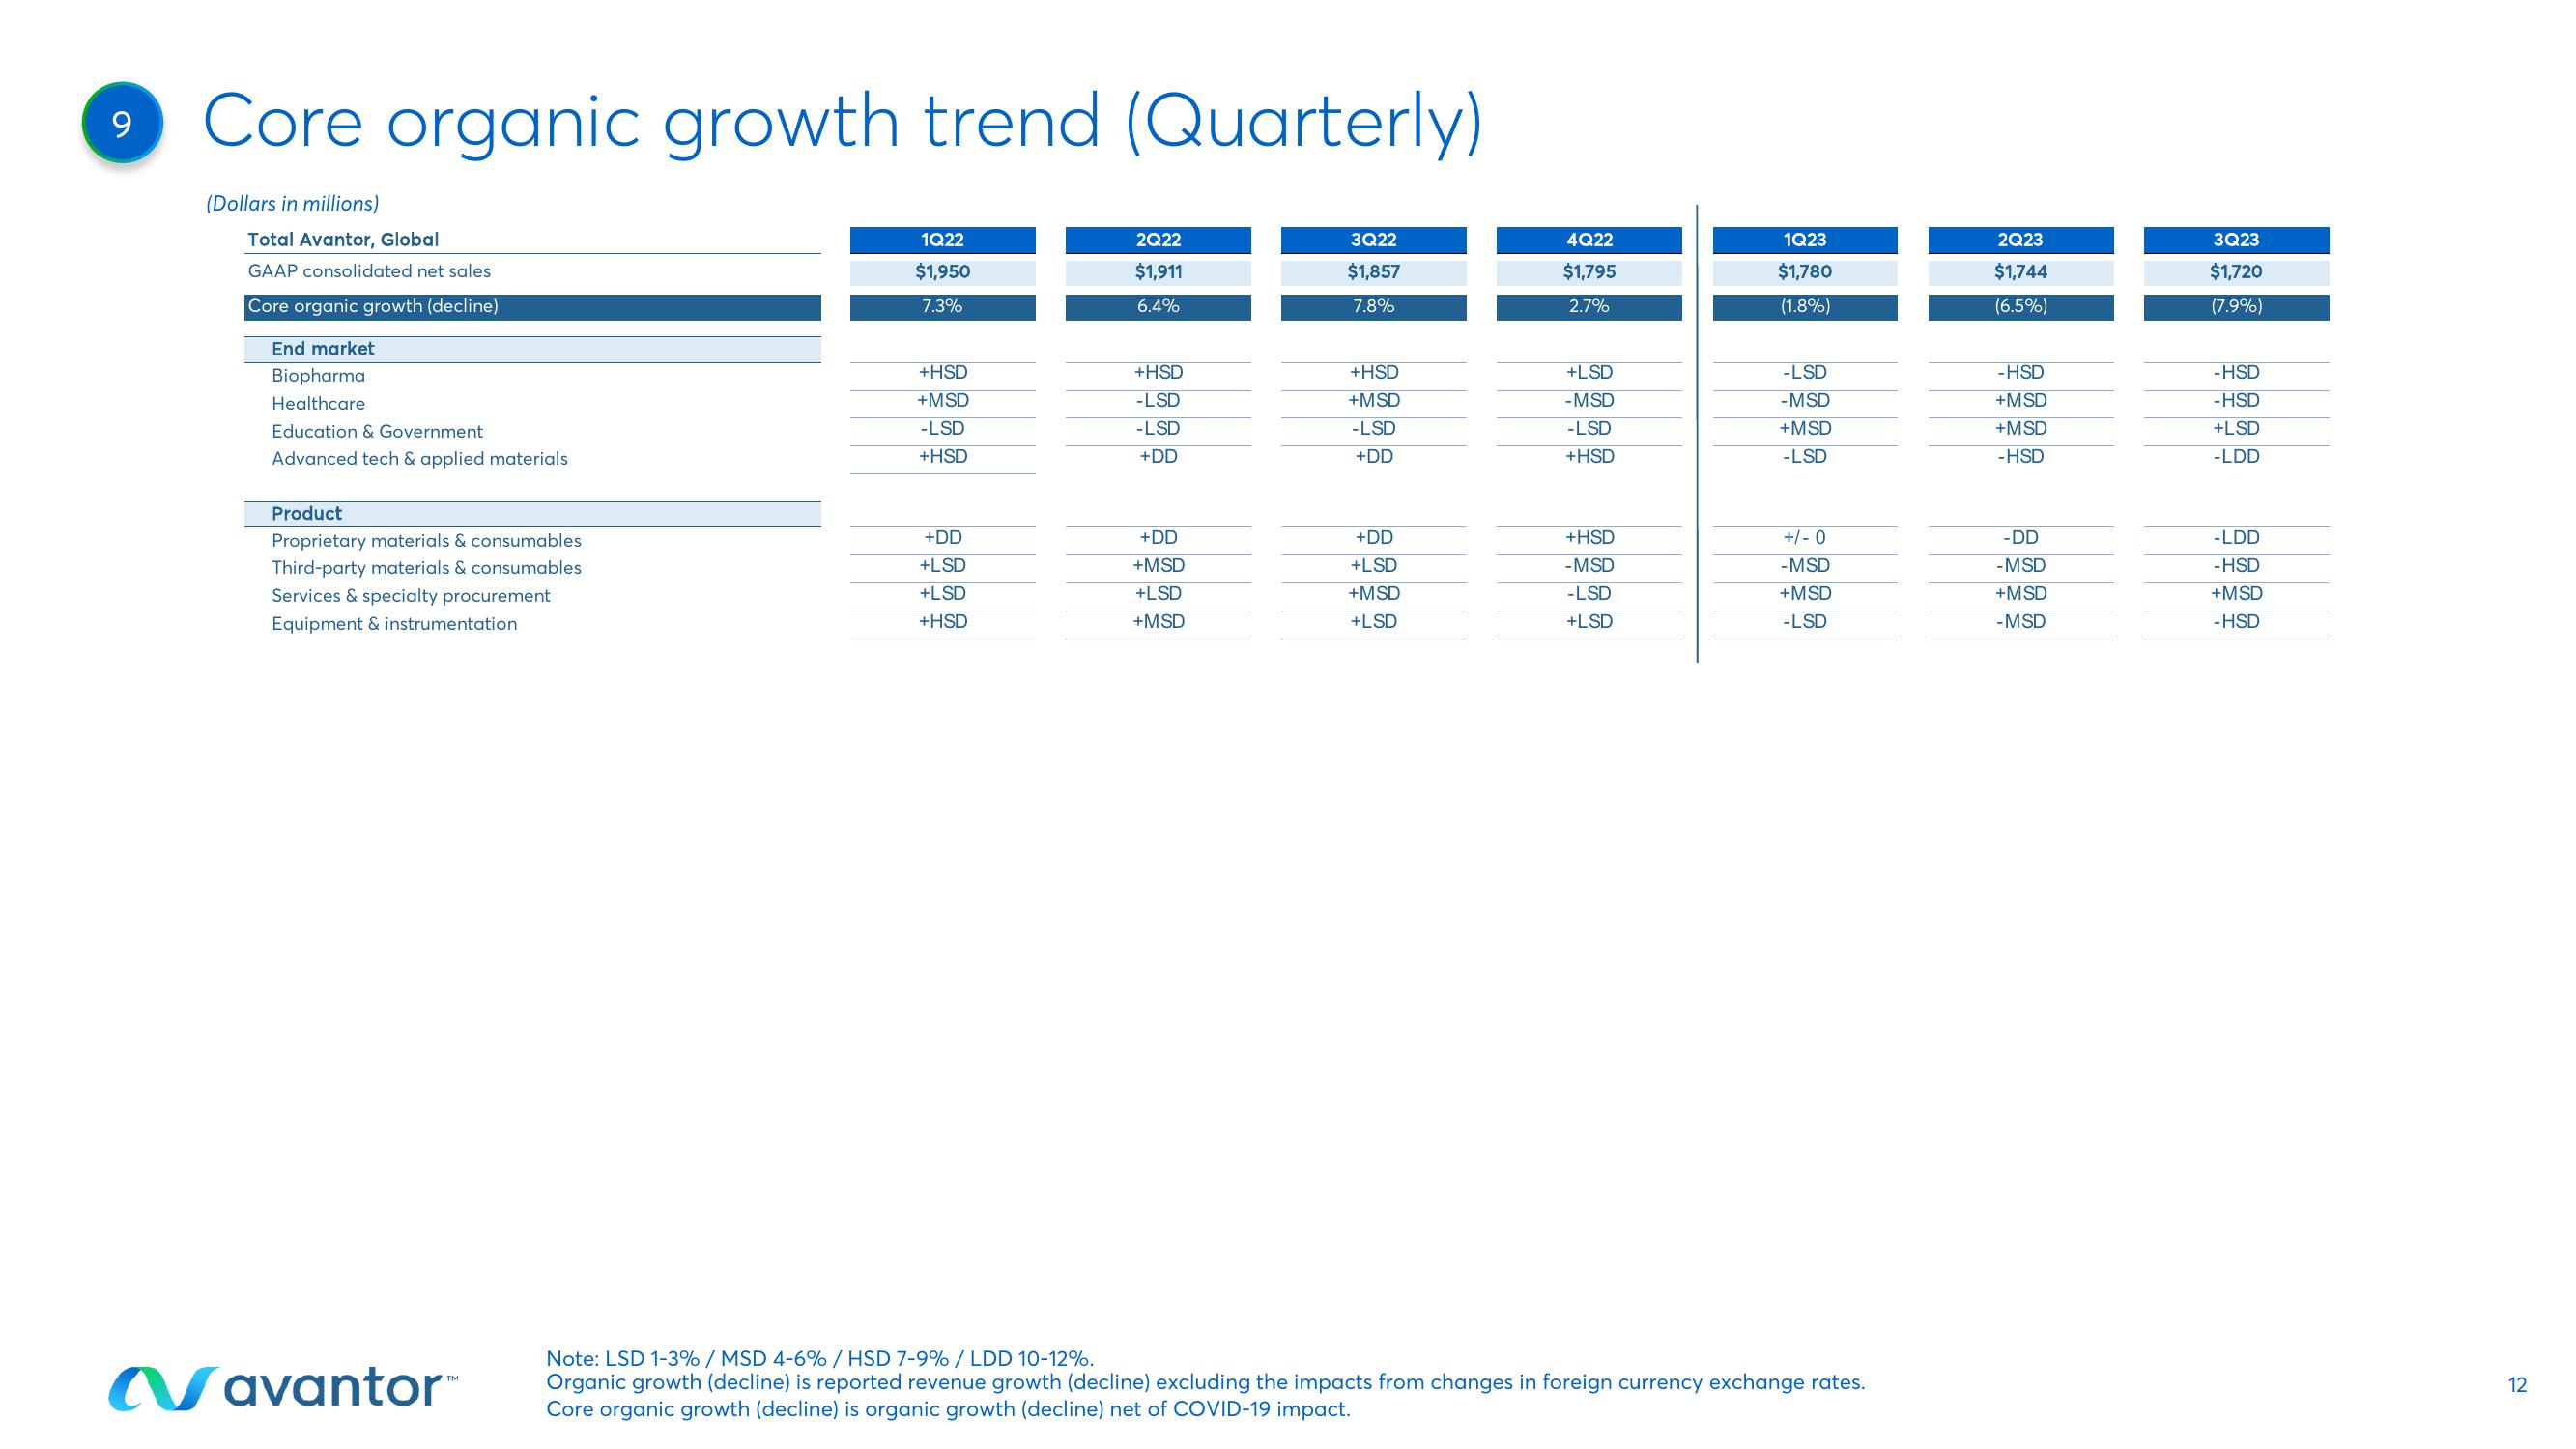
Core organic growth trend (Quarterly)
(Dollars in millions)
Total Avantor, Global
GAAP consolidated net sales
Core organic growth (decline)
End market
Biopharma
Healthcare
Education & Government
Advanced tech & applied materials
Product
Proprietary materials & consumables
Third-party materials & consumables
Services & specialty procurement
Equipment & instrumentation
Navantor™
1Q22
$1,950
7.3%
+HSD
+MSD
-LSD
+HSD
+DD
+LSD
+LSD
+HSD
2Q22
$1,911
6.4%
+HSD
- LSD
- LSD
+DD
+DD
+MSD
+LSD
+MSD
3Q22
$1,857
7.8%
+HSD
+MSD
-LSD
+DD
+DD
+LSD
+MSD
+LSD
4Q22
$1,795
2.7%
+LSD
-MSD
-LSD
+HSD
+HSD
-MSD
-LSD
+LSD
1Q23
$1,780
(1.8%)
-LSD
-MSD
+MSD
-LSD
+/- 0
-MSD
+MSD
-LSD
Note: LSD 1-3% / MSD 4-6% / HSD 7-9% / LDD 10-12%.
Organic growth (decline) is reported revenue growth (decline) excluding the impacts from changes in foreign currency exchange rates.
Core organic growth (decline) is organic growth (decline) net of COVID-19 impact.
2Q23
$1,744
(6.5%)
-HSD
+MSD
+MSD
-HSD
-DD
-MSD
+MSD
-MSD
3Q23
$1,720
(7.9%)
-HSD
-HSD
+LSD
-LDD
-LDD
-HSD
+MSD
-HSD
12View entire presentation