Xometry Results Presentation Deck
Q1 2022
Key Financial
Highlights
Xometry
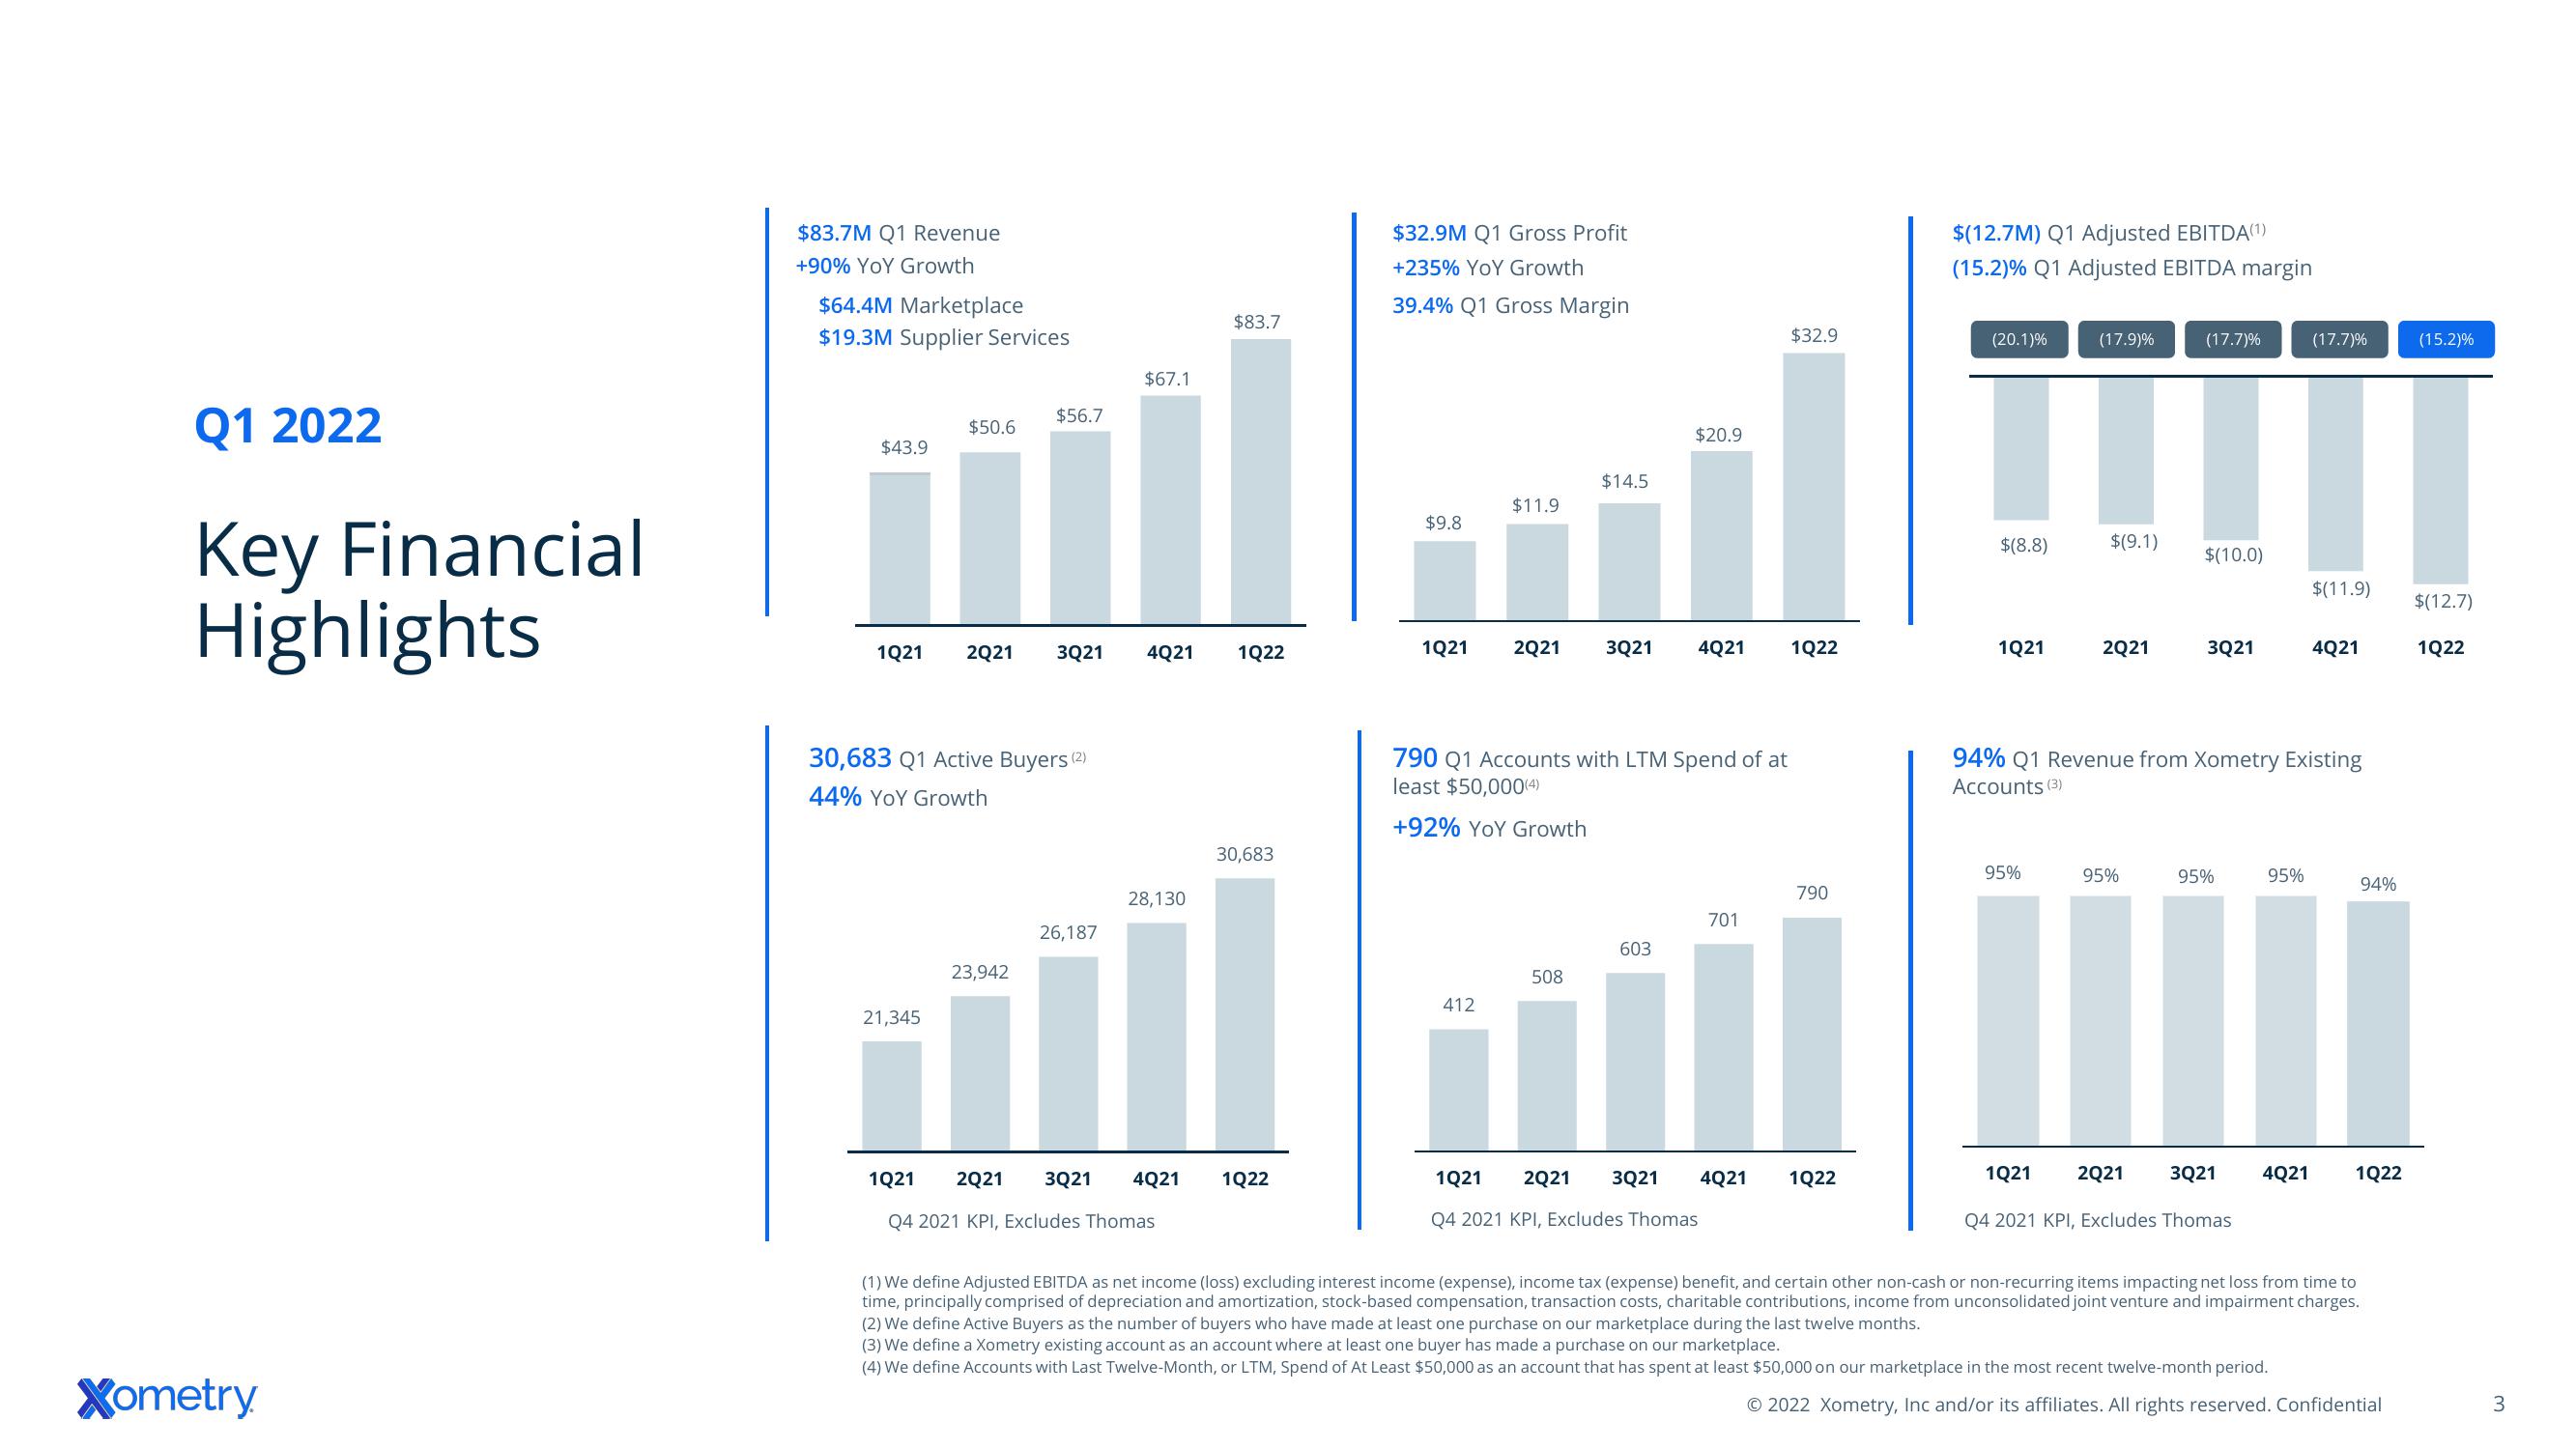
$83.7M Q1 Revenue
+90% YoY Growth
$64.4M Marketplace
$19.3M Supplier Services
$43.9
$50.6
1Q21 2Q21 3Q21
21,345
$56.7
30,683 Q1 Active Buyers (2)
44% YOY Growth
23,942
26,187
$67.1
4Q21 1Q22
28,130
$83.7
1Q21
Q4 2021 KPI, Excludes Thomas
30,683
2Q21 3Q21 4Q21 1Q22
$32.9M Q1 Gross Profit
+235% YoY Growth
39.4% Q1 Gross Margin
$9.8
$11.9
412
$14.5
1Q21 2Q21 3Q21 4Q21 1Q22
790 Q1 Accounts with LTM Spend of at
least $50,000(4)
+92% YoY Growth
508
$20.9
603
1Q21 2Q21 3Q21
Q4 2021 KPI, Excludes Thomas
$32.9
701
790
4Q21 1Q22
$(12.7M) Q1 Adjusted EBITDA(¹)
(15.2)% Q1 Adjusted EBITDA margin
(20.1)%
$(8.8)
1Q21
(17.9)%
95%
$(9.1)
2Q21
(17.7)%
95%
$(10.0)
3Q21
94% Q1 Revenue from Xometry Existing
Accounts (3)
95%
(17.7)%
95%
$(11.9)
4Q21
94%
1Q21 2Q21 3Q21 4Q21 1Q22
Q4 2021 KPI, Excludes Thomas
(1) We define Adjusted EBITDA as net income (loss) excluding interest income (expense), income tax (expense) benefit, and certain other non-cash or non-recurring items impacting net loss from time to
time, principally comprised of depreciation and amortization, stock-based compensation, transaction costs, charitable contributions, income from unconsolidated joint venture and impairment charges.
(2) We define Active Buyers as the number of buyers who have made at least one purchase on our marketplace during the last twelve months.
(3) We define a Xometry existing account as an account where at least one buyer has made a purchase on our marketplace.
(4) We define Accounts with Last Twelve-Month, or LTM, Spend of At Least $50,000 as an account that has spent at least $50,000 on our marketplace in the most recent twelve-month period.
© 2022 Xometry, Inc and/or its affiliates. All rights reserved. Confidential
(15.2)%
$(12.7)
1Q22
3View entire presentation