Clover Health Investor Presentation Deck
CA Sets Us Up To Leverage Stars Improvements To Produce
Industry Level MCRs At Industry-Leading Growth
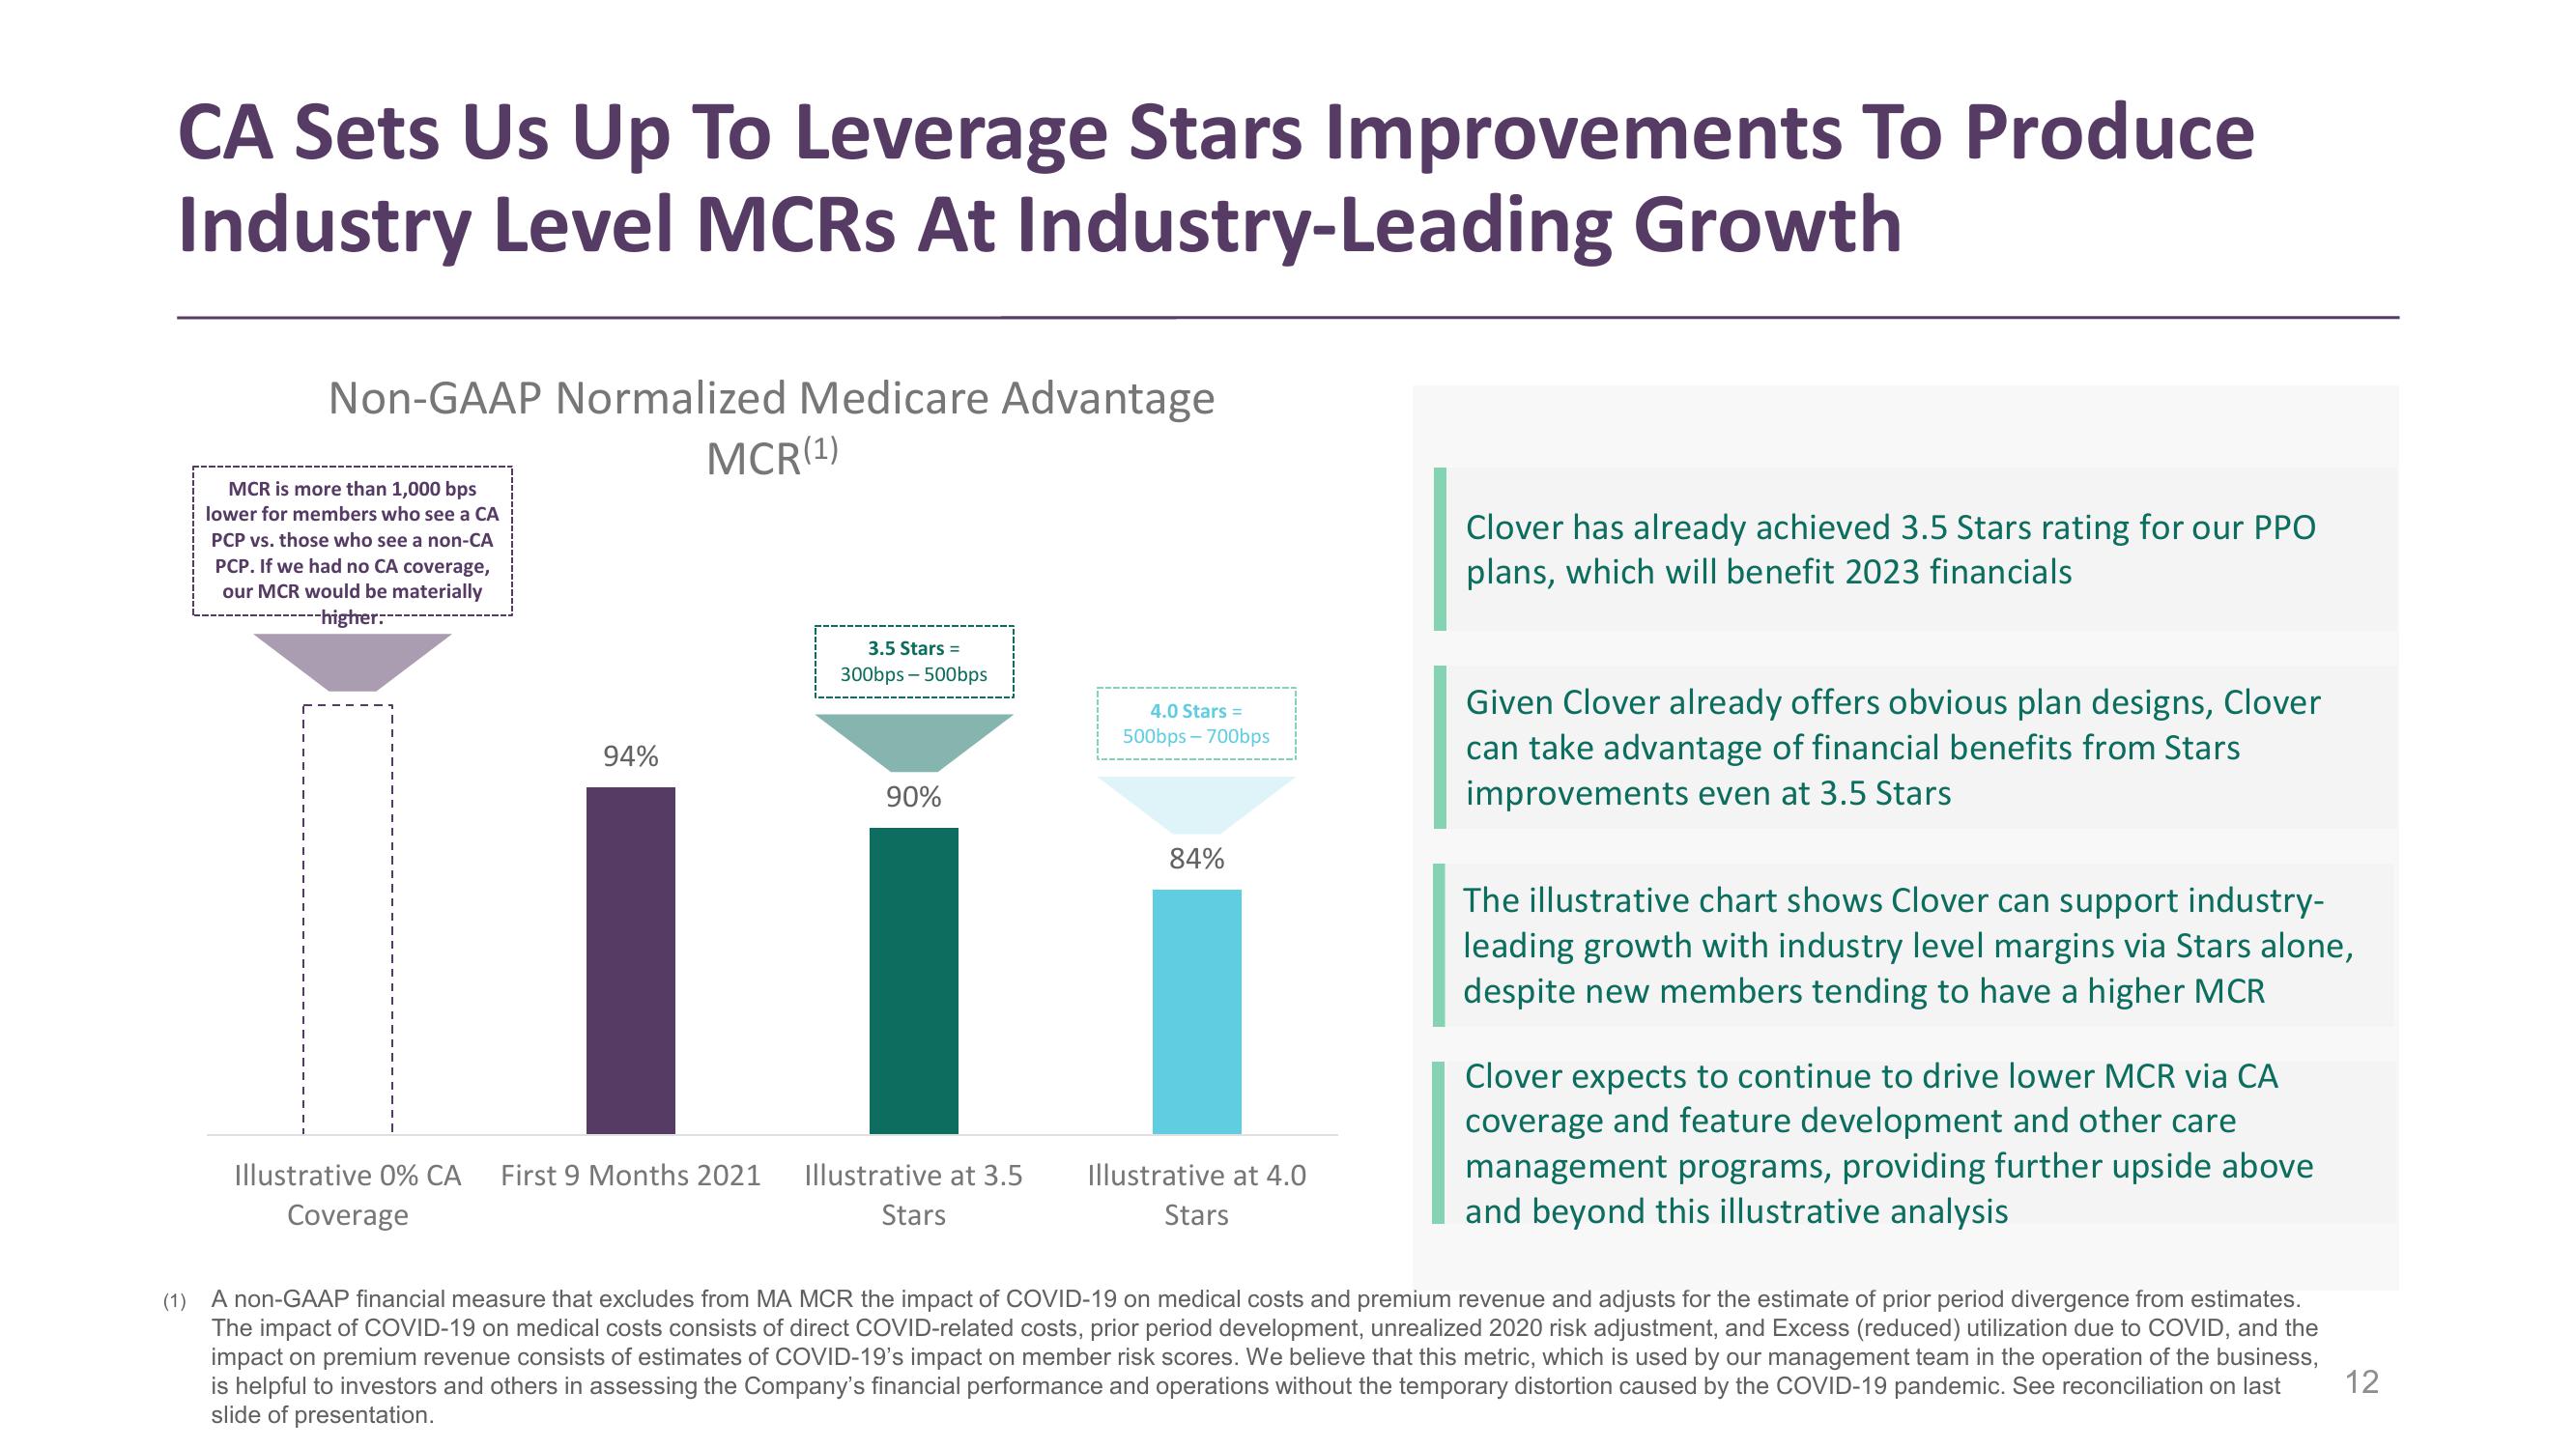
Non-GAAP Normalized Medicare Advantage
MCR (1)
MCR is more than 1,000 bps
lower for members who see a CA
PCP vs. those who see a non-CA
PCP. If we had no CA coverage,
our MCR would be materially
---higher:-
94%
Illustrative 0% CA First 9 Months 2021
Coverage
3.5 Stars =
300bps-500bps
90%
Illustrative at 3.5
Stars
4.0 Stars =
500bps-700bps
84%
Illustrative at 4.0
Stars
Clover has already achieved 3.5 Stars rating for our PPO
plans, which will benefit 2023 financials
Given Clover already offers obvious plan designs, Clover
can take advantage of financial benefits from Stars
improvements even at 3.5 Stars
The illustrative chart shows Clover can support industry-
leading growth with industry level margins via Stars alone,
despite new members tending to have a higher MCR
Clover expects to continue to drive lower MCR via CA
coverage and feature development and other care
management programs, providing further upside above
and beyond this illustrative analysis
(1) A non-GAAP financial measure that excludes from MA MCR the impact of COVID-19 on medical costs and premium revenue and adjusts for the estimate of prior period divergence from estimates.
The impact of COVID-19 on medical costs consists of direct COVID-related costs, prior period development, unrealized 2020 risk adjustment, and Excess (reduced) utilization due to COVID, and the
impact on premium revenue consists of estimates of COVID-19's impact on member risk scores. We believe that this metric, which is used by our management team in the operation of the business,
is helpful to investors and others in assessing the Company's financial performance and operations without the temporary distortion caused by the COVID-19 pandemic. See reconciliation on last
slide of presentation.
12View entire presentation