AMC Other Presentation Deck
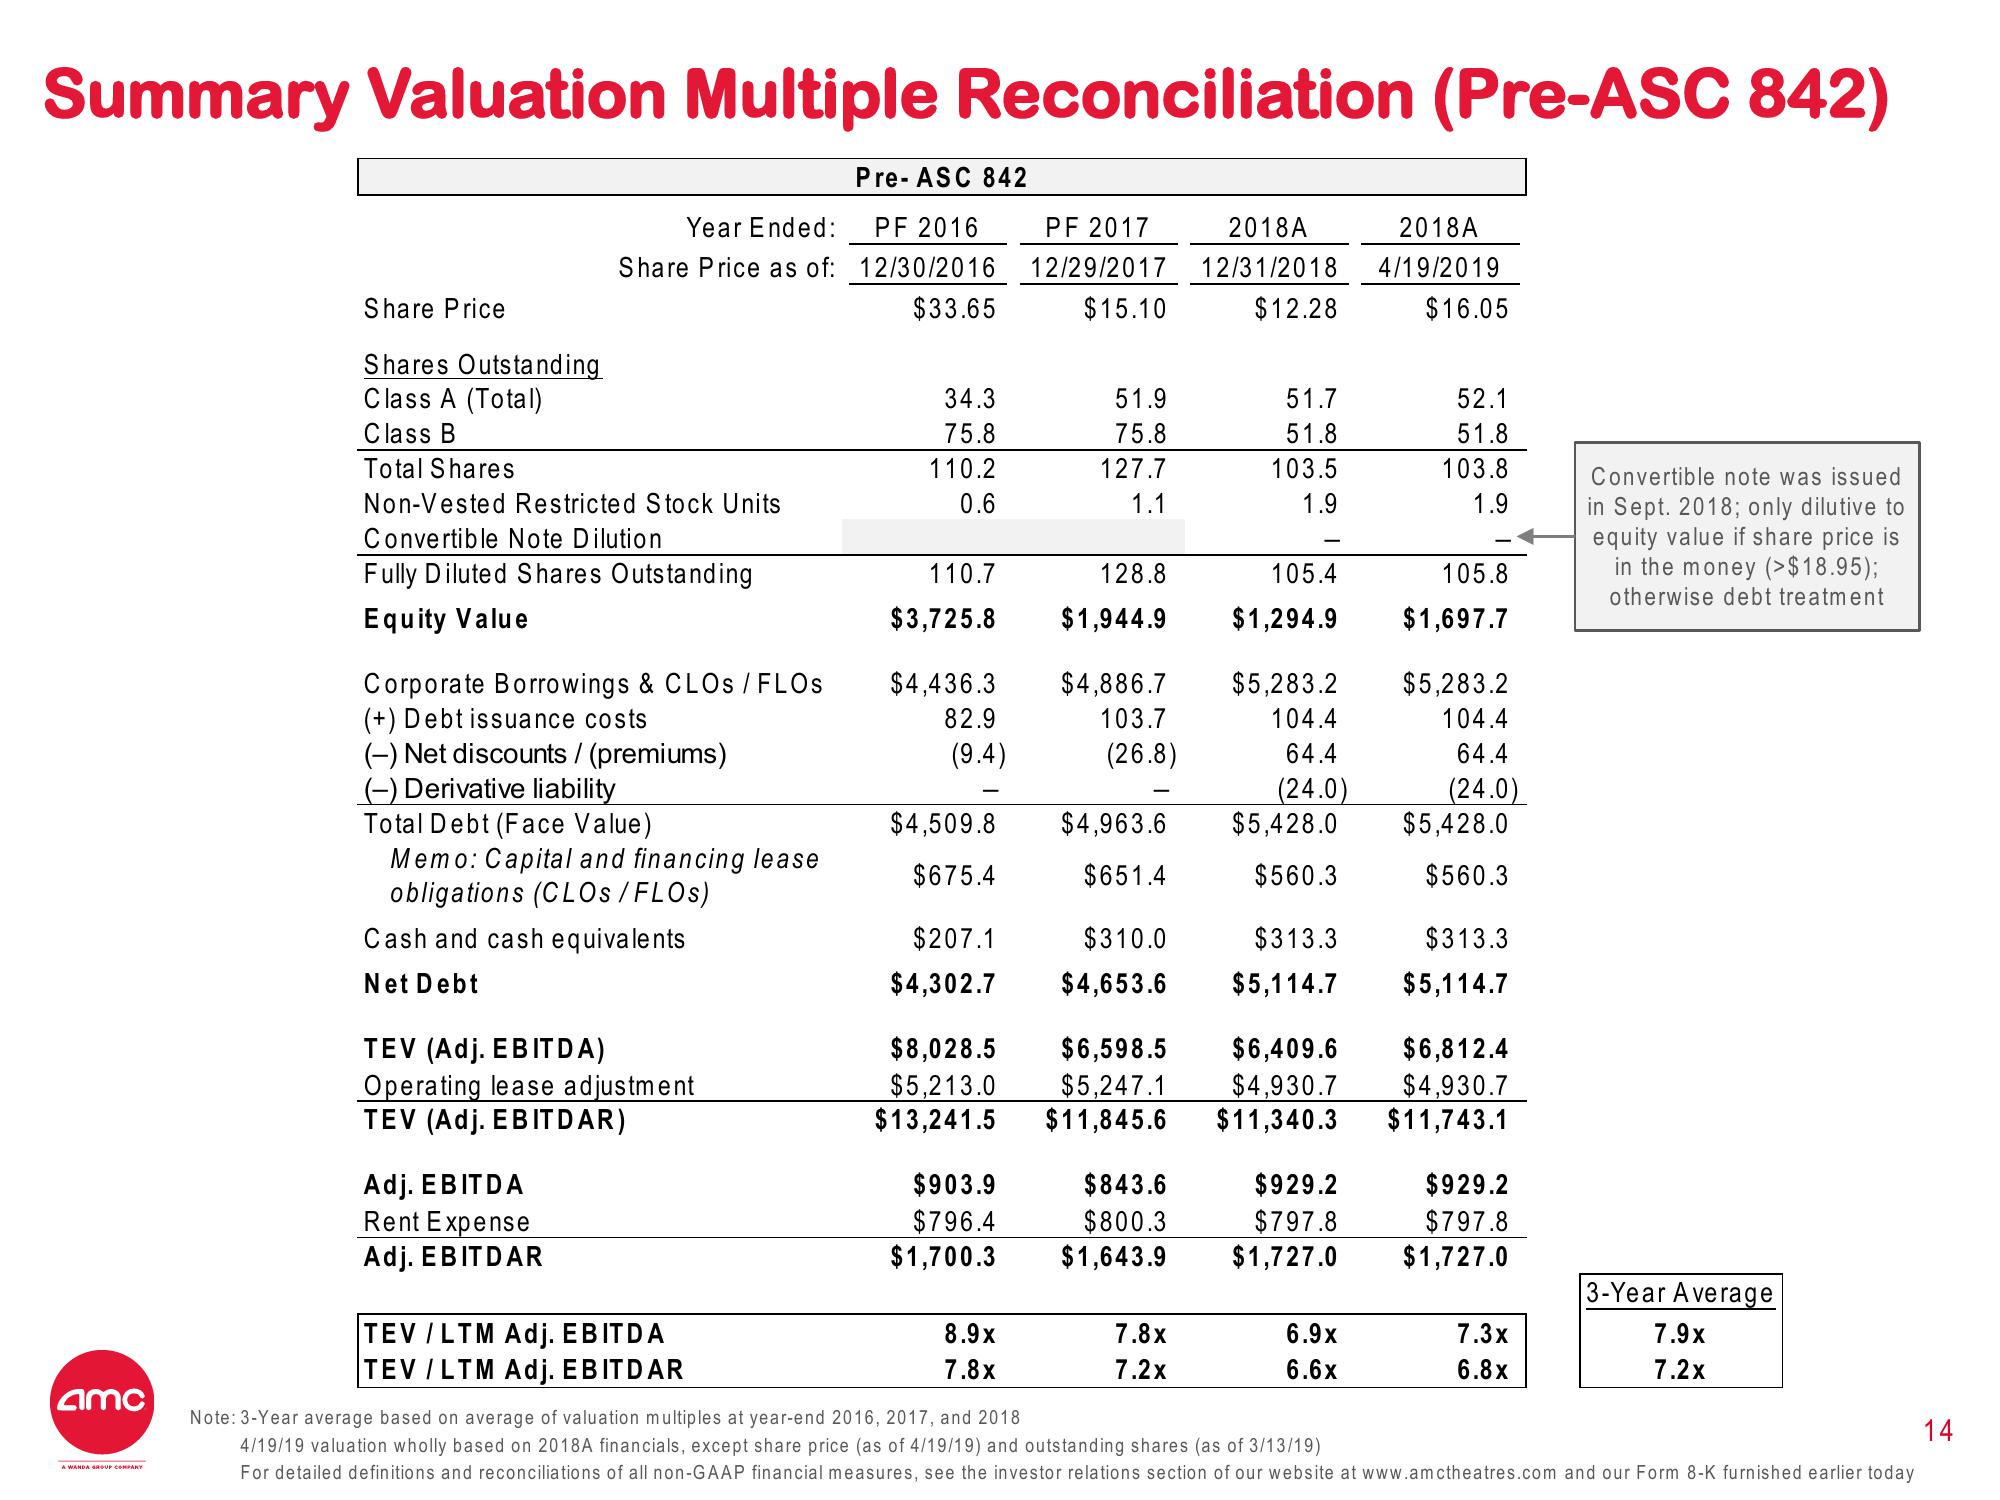
Summary Valuation Multiple Reconciliation (Pre-ASC 842)
amc
A WANDA GROUP COMPANY
Share Price
Shares Outstanding
Class A (Total)
Class B
Total Shares
Year Ended:
Share Price as of:
Non-Vested Restricted Stock Units
Convertible Note Dilution
Fully Diluted Shares Outstanding
Equity Value
Corporate Borrowings & CLOs / FLOs
(+) Debt issuance costs
(-) Net discounts / (premiums)
(-) Derivative liability
Total Debt (Face Value)
Memo: Capital and financing lease
obligations (CLOS / FLOS)
Cash and cash equivalents
Net Debt
TEV (Adj. EBITDA)
Operating lease adjustment
TEV (Adj. EBITDAR)
Adj. EBITDA
Rent Expense
Adj. EBITDAR
TEV/LTM Adj. EBITDA
TEV / LTM Adj. EBITDAR
Pre- ASC 842
PF 2016
12/30/2016
$33.65
34.3
75.8
110.2
0.6
110.7
$3,725.8
$4,436.3
82.9
(9.4)
$4,509.8
$675.4
PF 2017
12/29/2017
$15.10
51.9
75.8
127.7
1.1
128.8
$1,944.9
8.9x
7.8x
$4,886.7
103.7
(26.8)
$4,963.6
$651.4
$207.1
$310.0
$4,302.7 $4,653.6
$903.9
$843.6
$796.4
$800.3
$1,700.3 $1,643.9
2018A
12/31/2018
$12.28
7.8x
7.2x
51.7
51.8
103.5
1.9
105.4
$1,294.9
$5,283.2
104.4
64.4
(24.0)
$8,028.5 $6,598.5 $6,409.6
$5,213.0
$5,247.1
$4,930.7
$13,241.5
$11,845.6 $11,340.3
$5,428.0
$560.3
$313.3
$5,114.7
$929.2
$797.8
$1,727.0
6.9x
6.6x
2018A
4/19/2019
$16.05
52.1
51.8
103.8
1.9
105.8
$1,697.7
$5,283.2
104.4
64.4
(24.0)
$5,428.0
$560.3
$313.3
$5,114.7
$6,812.4
$4,930.7
$11,743.1
$929.2
$797.8
$1,727.0
7.3x
6.8x
Convertible note was issued
in Sept. 2018; only dilutive to
equity value if share price is
in the money (>$18.95);
otherwise debt treatment
3-Year Average
7.9x
7.2x
Note: 3-Year average based on average of valuation multiples at year-end 2016, 2017, and 2018
4/19/19 valuation wholly based on 2018A financials, except share price (as of 4/19/19) and outstanding shares (as of 3/13/19)
For detailed definitions and reconciliations of all non-GAAP financial measures, see the investor relations section of our website at www.amctheatres.com and our Form 8-K furnished earlier today
14View entire presentation