Lulus IPO Presentation Deck
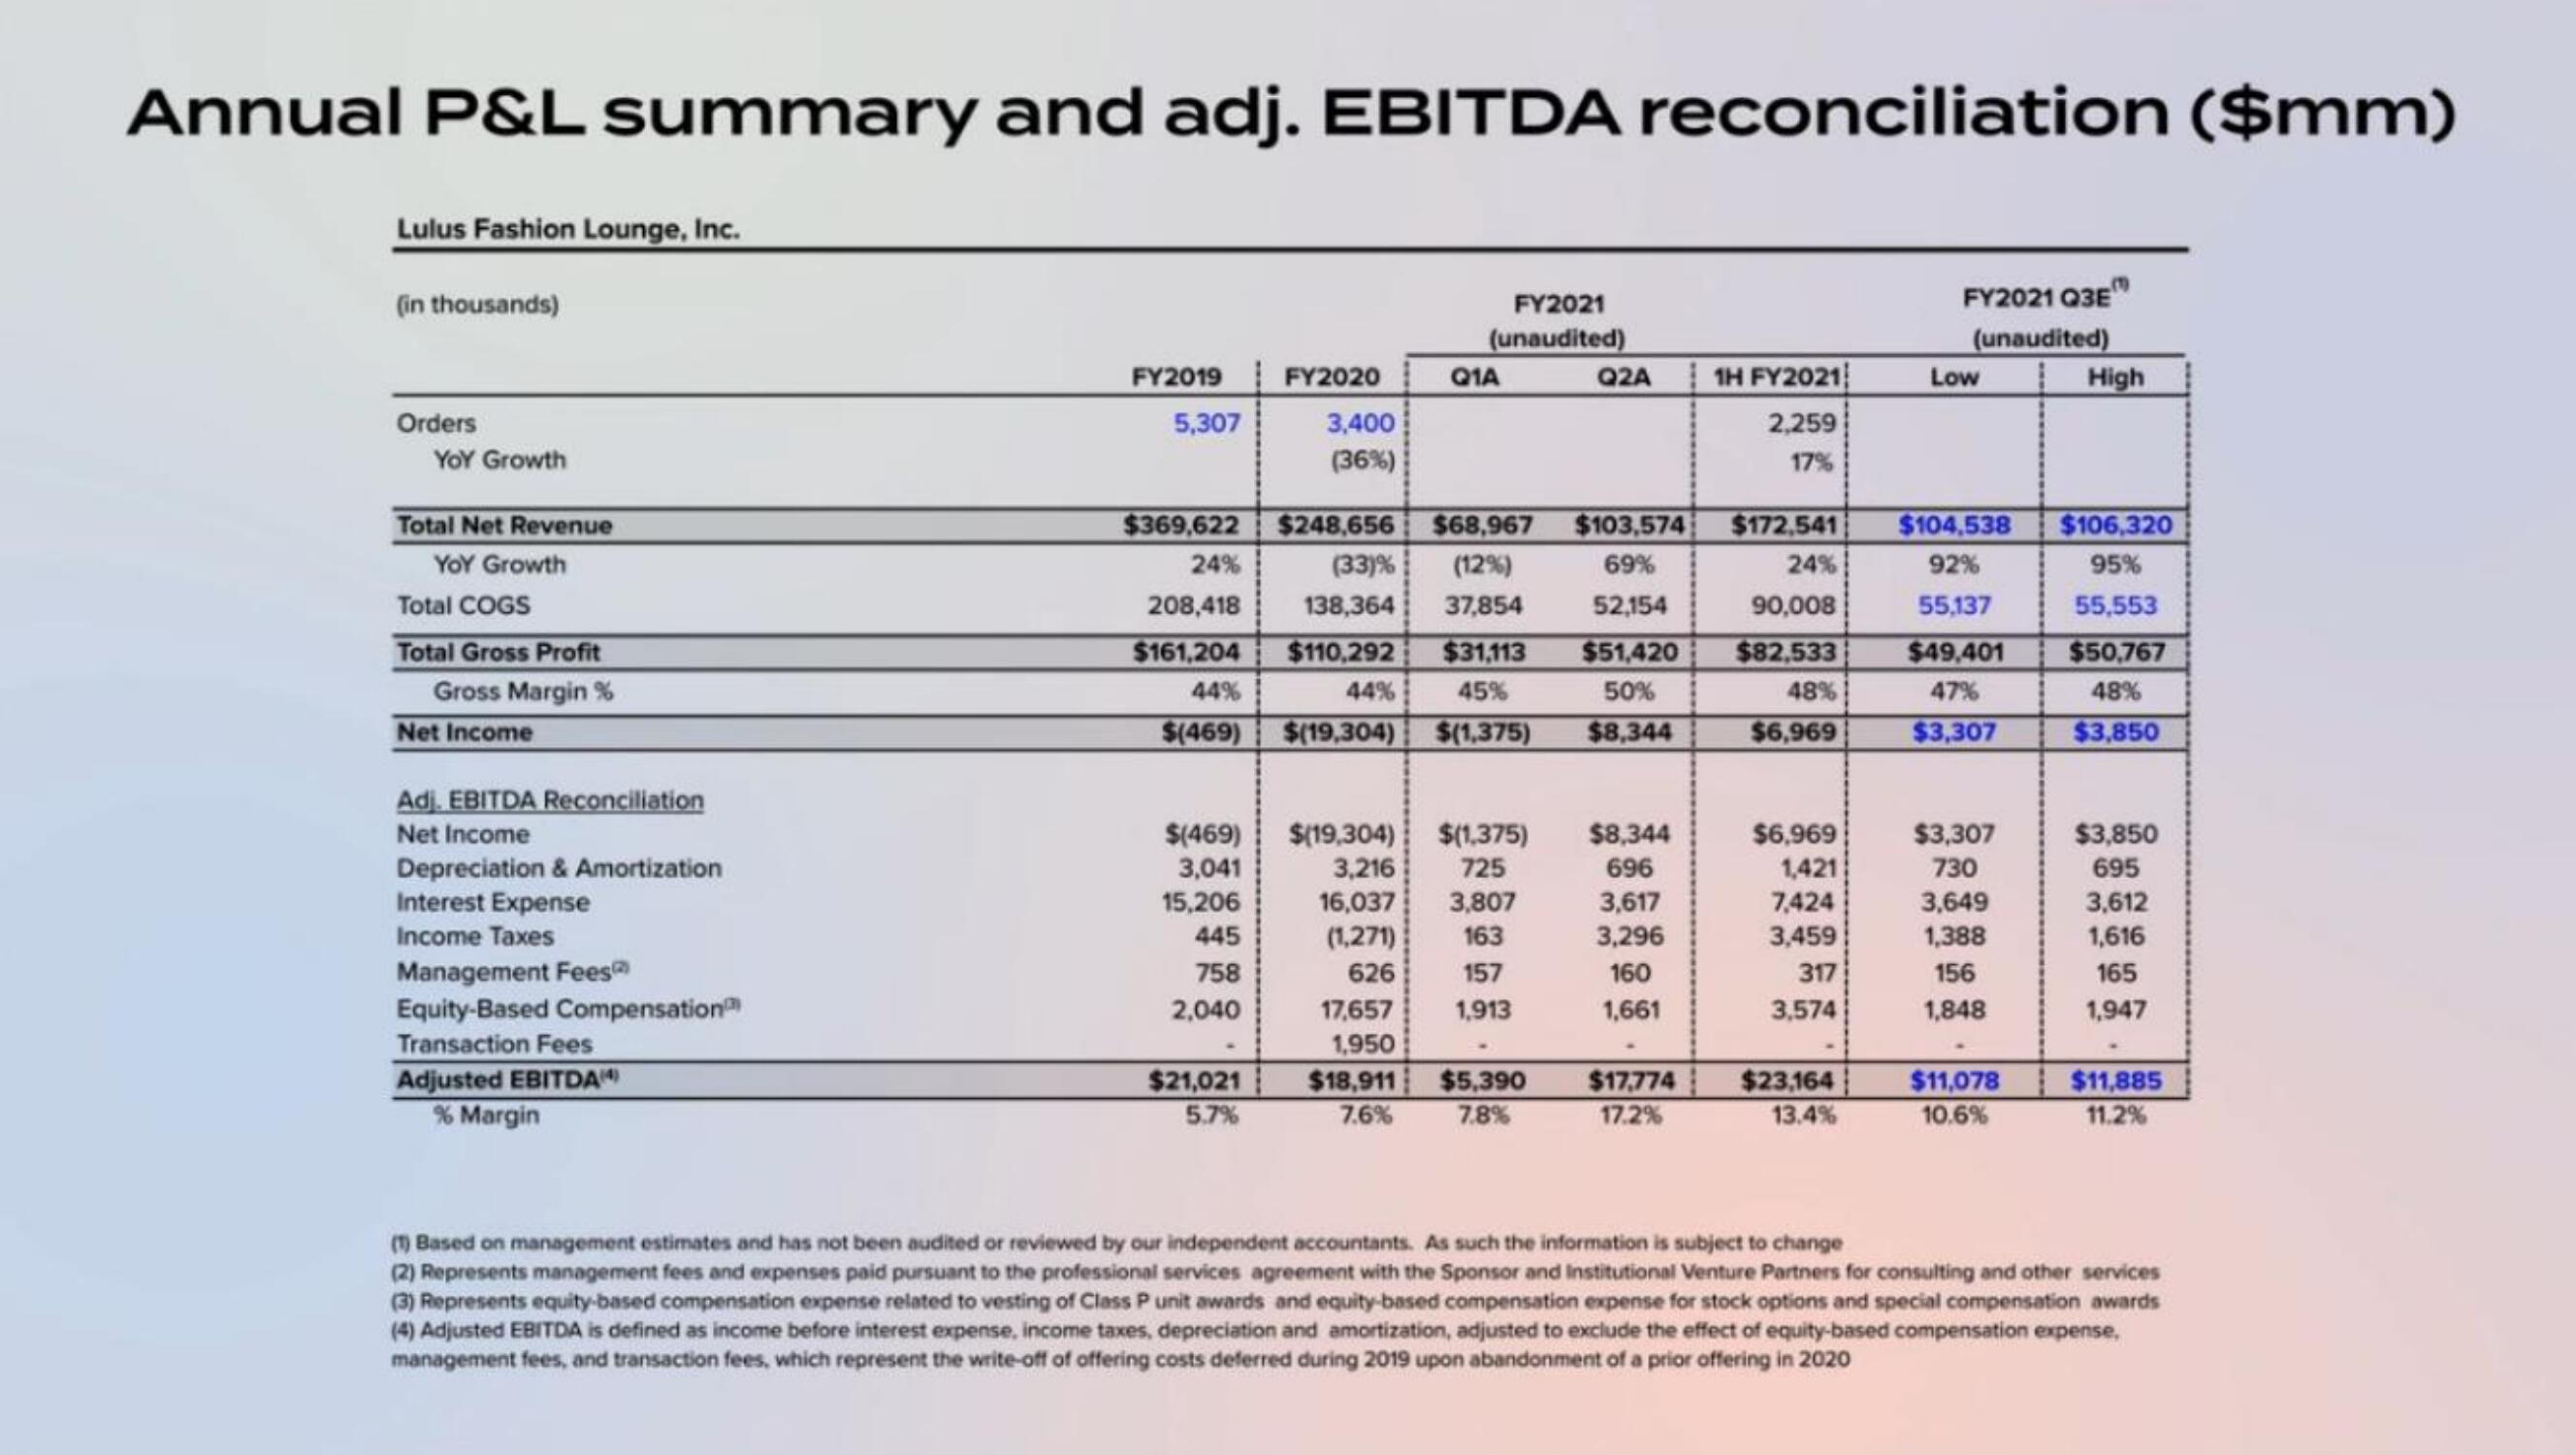
Annual P&L summary and adj. EBITDA reconciliation ($mm)
Lulus Fashion Lounge, Inc.
(in thousands)
Orders
YOY Growth
Total Net Revenue
YOY Growth
Total COGS
Total Gross Profit
Gross Margin%
Net Income
Adj. EBITDA Reconciliation
Net Income
Depreciation & Amortization
Interest Expense
Income Taxes
Management Fees
Equity-Based Compensation
Transaction Fees
Adjusted EBITDA(4)
% Margin
FY2019 FY2020
5,307
3,400
(36%)
$(469)
3,041
15,206
445
758
2,040
$21,021
5.7%
FY2021
(unaudited)
Q1A
$369,622
24%
208,418
$161,204
44%
$248,656 $68,967 $103,574 $172,541
(33) % (12%)
69%
24%
138,364 37,854 52,154
90,008
$110,292 $31,113 $51,420 $82,533
44% 45%
50%
48%
$(469) $(19,304) $(1,375) $8,344 $6,969
17,657
1,950
$18,911
7.6%
$(19,304) $(1,375)
3,216 725
16,037 3,807
(1,271) 163
157
626
1,913
Q2A
$5,390
7.8%
$8,344
696
3,617
3,296
160
1,661
1H FY2021
2,259
17%
$17,774
17.2%
$6,969
1,421
7,424
3,459
317
3,574
$23,164
13.4%
FY2021 Q3E
(unaudited)
Low
$104,538 $106,320
92%
55,137
$49,401
47%
$3,307
95%
55,553
$50,767
48%
$3,850
$3,307
730
3,649
1,388
156
1,848
High
$11,078
10.6%
$3,850
695
3,612
1,616
165
1,947
$11,885
11.2%
(1) Based on management estimates and has not been audited or reviewed by our independent accountants. As such the information is subject to change
(2) Represents management fees and expenses paid pursuant to the professional services agreement with the Sponsor and Institutional Venture Partners for consulting and other services
(3) Represents equity-based compensation expense related to vesting of Class P unit awards and equity-based compensation expense for stock options and special compensation awards
(4) Adjusted EBITDA is defined as income before interest expense, income taxes, depreciation and amortization, adjusted to exclude the effect of equity-based compensation expense,
management fees, and transaction fees, which represent the write-off of offering costs deferred during 2019 upon abandonment of a prior offering in 2020View entire presentation