J.P.Morgan Results Presentation Deck
JPMORGAN CHASE & CO.
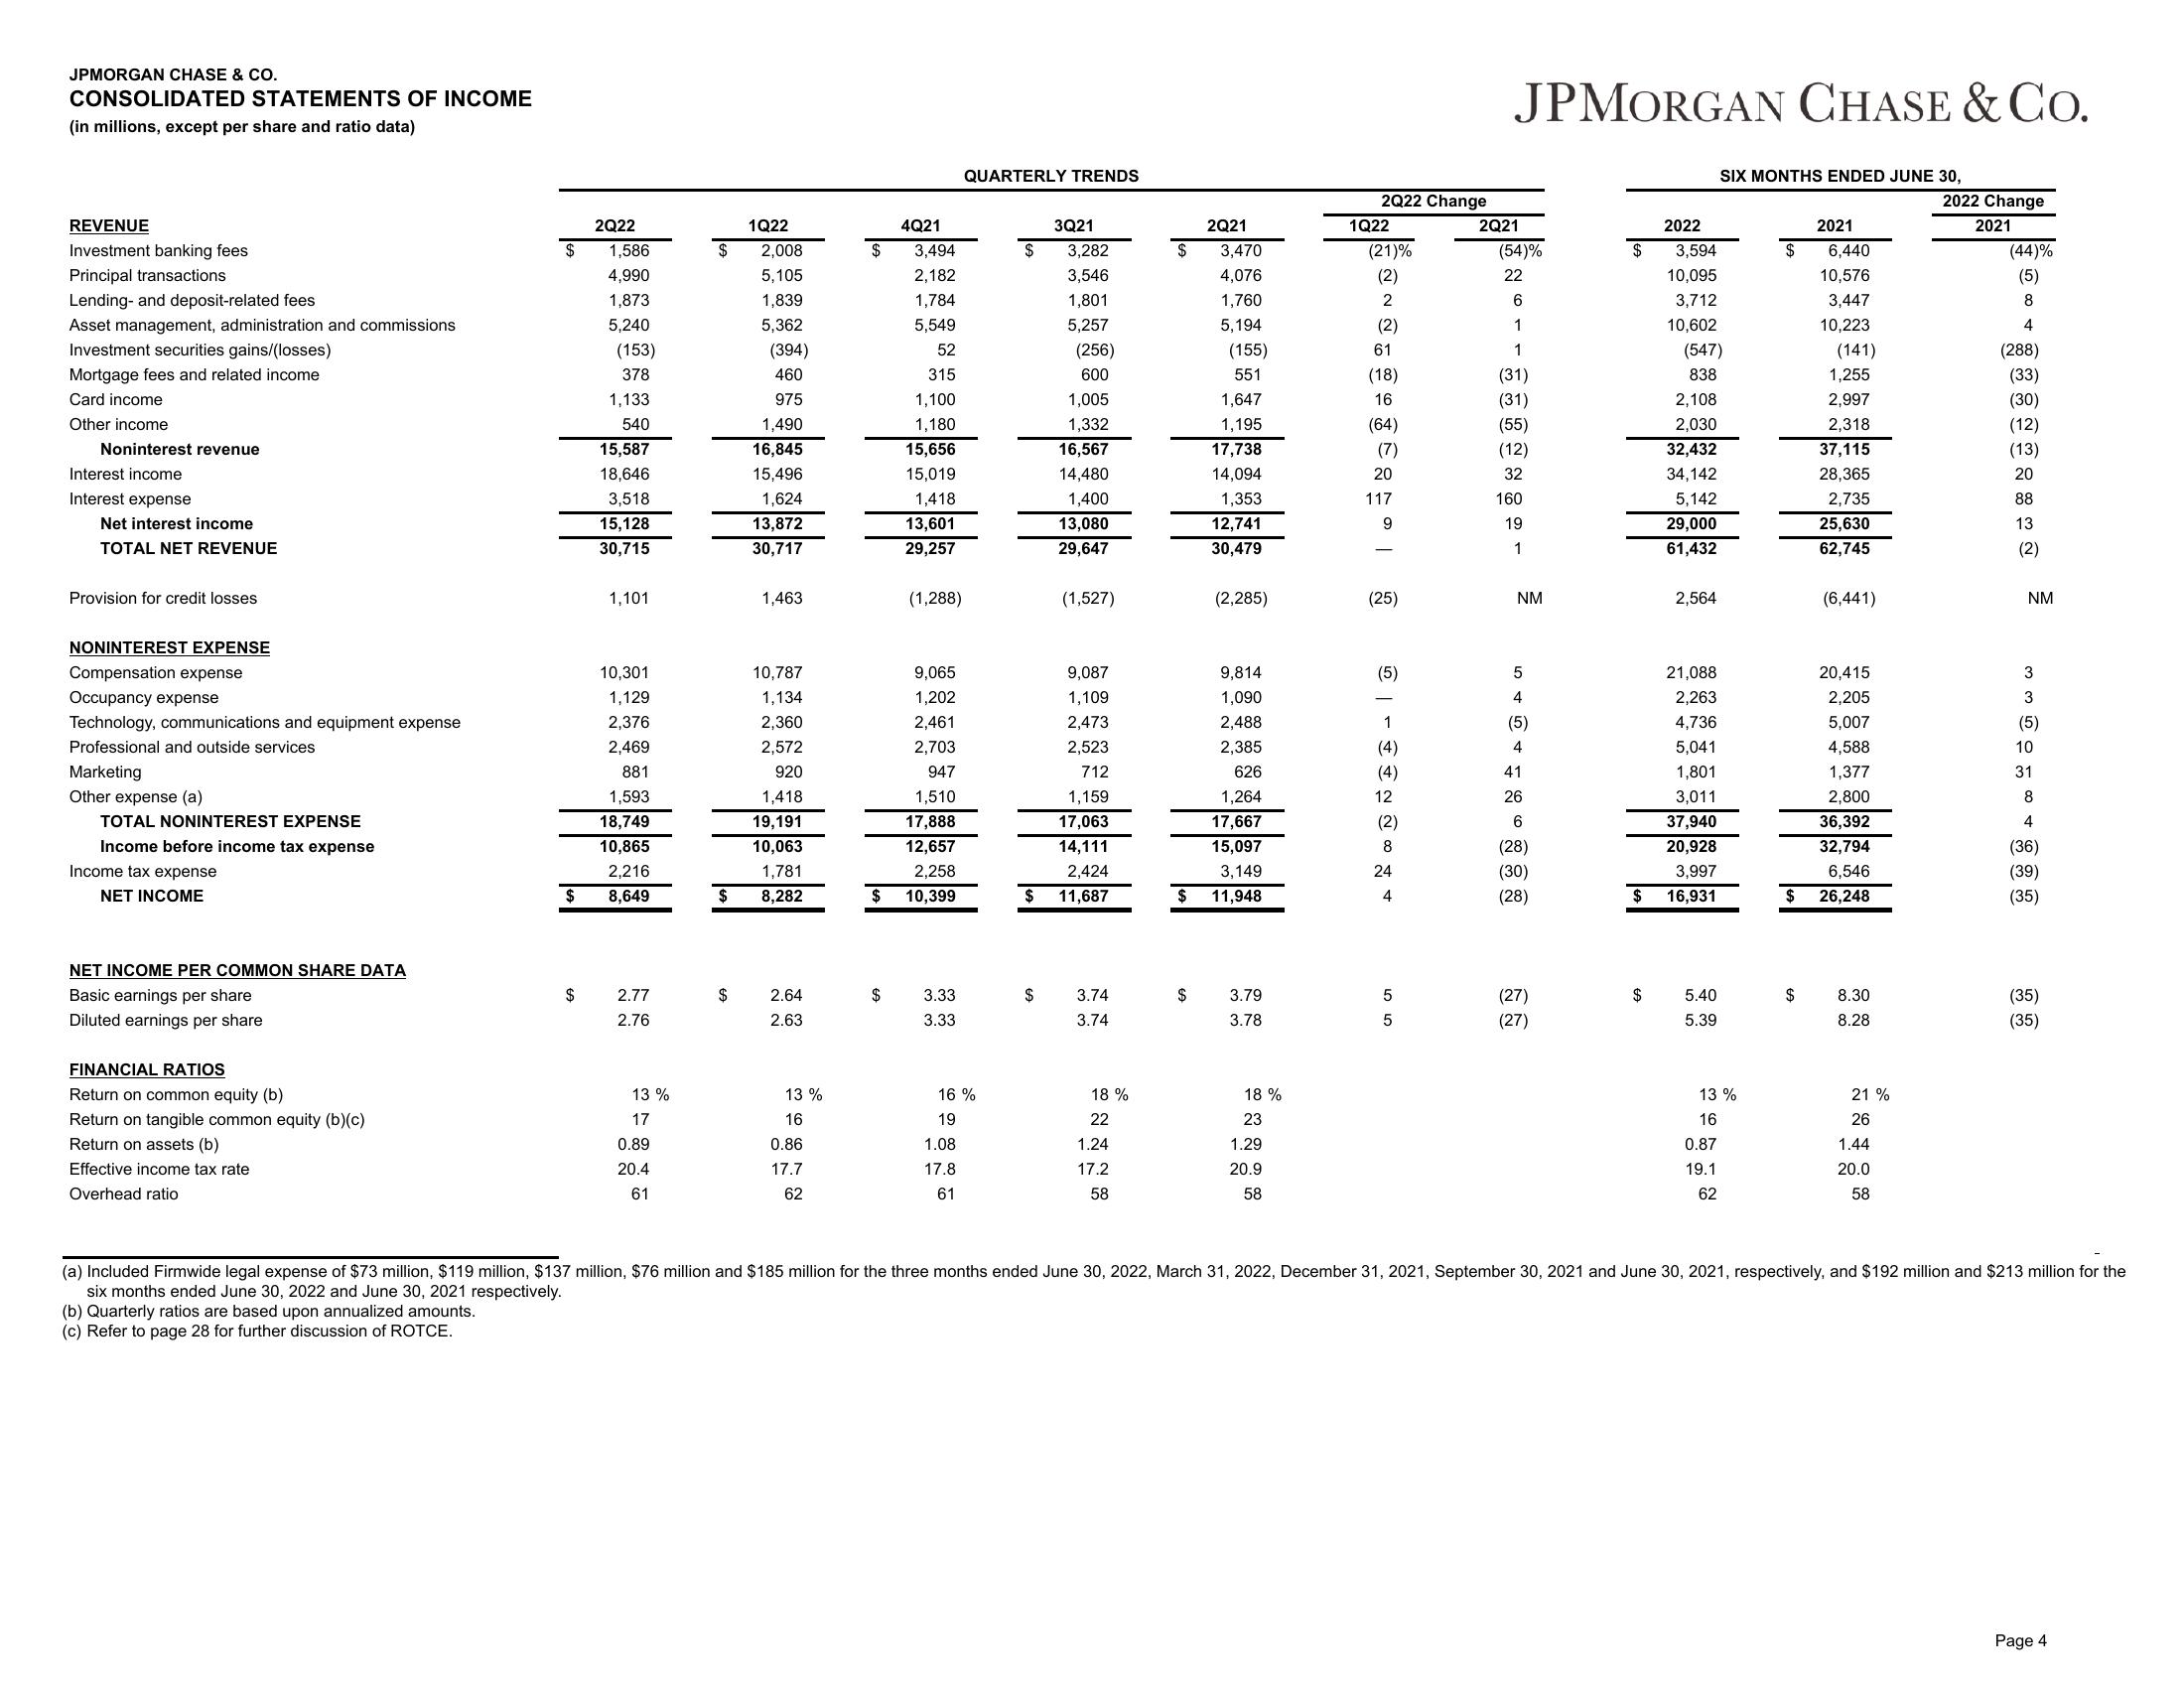
CONSOLIDATED STATEMENTS OF INCOME
(in millions, except per share and ratio data)
REVENUE
Investment banking fees
Principal transactions
Lending- and deposit-related fees
Asset management, administration and commissions
Investment securities gains/(losses)
Mortgage fees and related income
Card income
Other income
Noninterest revenue
Interest income
Interest expense
Net interest income
TOTAL NET REVENUE
Provision for credit losses
NONINTEREST EXPENSE
Compensation expense
Occupancy expense
Technology, communications and equipment expense
Professional and outside services
Marketing
Other expense (a)
TOTAL NONINTEREST EXPENSE
Income before income tax expense
Income tax expense
NET INCOME
NET INCOME PER COMMON SHARE DATA
Basic earnings per share
Diluted earnings per share
FINANCIAL RATIOS
Return on common equity (b)
Return on tangible common equity (b)(c)
Return on assets (b)
Effective income tax rate
Overhead ratio
$
$
2Q22
1,586
4,990
1,873
5,240
(153)
378
1,133
540
15,587
18,646
3,518
15,128
30,715
1,101
10,301
1,129
2,376
2,469
881
1,593
18,749
10,865
2,216
8,649
2.77
2.76
13 %
17
0.89
20.4
61
$
1Q22
$
2,008
5,105
1,839
5,362
(394)
460
975
1,490
16,845
15,496
1,624
13,872
30,717
1,463
10,787
1,134
2,360
2,572
920
1,418
19,191
10,063
1,781
$ 8,282
2.64
2.63
13 %
16
0.86
17.7
62
$
4Q21
3,494
2,182
1,784
5,549
$
52
315
1,100
1,180
15,656
15,019
1,418
13,601
29,257
(1,288)
9,065
1,202
2,461
2,703
947
1,510
17,888
12,657
2,258
$ 10,399
3.33
3.33
QUARTERLY TRENDS
16 %
19
1.08
17.8
61
$
$
$
3Q21
3,282
3,546
1,801
5,257
(256)
600
1,005
1,332
16,567
14,480
1,400
13,080
29,647
(1,527)
9,087
1,109
2,473
2,523
712
1,159
17,063
14,111
2,424
11,687
3.74
3.74
18%
22
1.24
17.2
58
$
$
$
2Q21
3,470
4,076
1,760
5,194
(155)
551
1,647
1,195
17,738
14,094
1,353
12,741
30,479
(2,285)
9,814
1,090
2,488
2,385
626
1,264
17,667
15,097
3,149
11,948
3.79
3.78
18%
23
1.29
20.9
58
2Q22 Change
1Q22
(21)%
(2)
2
(2)
61
(18)
16
(64)
(7)
20
117
9
(25)
(5)
A ∞ -
(4)
(4)
12
(2)
24
5
5
JPMORGAN CHASE & CO.
2Q21
(54)%
22
6
1
1
(31)
(31)
(55)
(12)
32
160
19
1
NM
5
4
(5)
4
41
26
6
(28)
(30)
(28)
(27)
(27)
$
$
2022
3,594
10,095
3,712
10,602
(547)
838
2,108
2,030
32,432
34,142
5,142
29,000
61,432
2,564
21,088
2,263
4,736
5,041
1,801
3,011
37,940
20,928
3,997
$ 16,931
SIX MONTHS ENDED JUNE 30,
5.40
5.39
13%
16
0.87
19.1
62
$
$
$
2021
6,440
10,576
3,447
10,223
(141)
1,255
2,997
2,318
37,115
28,365
2,735
25,630
62,745
(6,441)
20,415
2,205
5,007
4,588
1,377
2,800
36,392
32,794
6,546
26,248
8.30
8.28
21%
26
1.44
20.0
58
2022 Change
2021
(44)%
(5)
8
4
(288)
(33)
(30)
(12)
(13)
20
88
13
(2)
NM
3
3
(5)
10
31
8
4
(36)
(39)
(35)
(35)
(35)
(a) Included Firmwide legal expense of $73 million, $119 million, $137 million, $76 million and $185 million for the three months ended June 30, 2022, March 31, 2022, December 31, 2021, September 30, 2021 and June 30, 2021, respectively, and $192 million and $213 million for the
six months ended June 30, 2022 and June 30, 2021 respectively.
(b) Quarterly ratios are based upon annualized amounts.
(c) Refer to page 28 for further discussion of ROTCE.
Page 4View entire presentation