Pershing Square Activist Presentation Deck
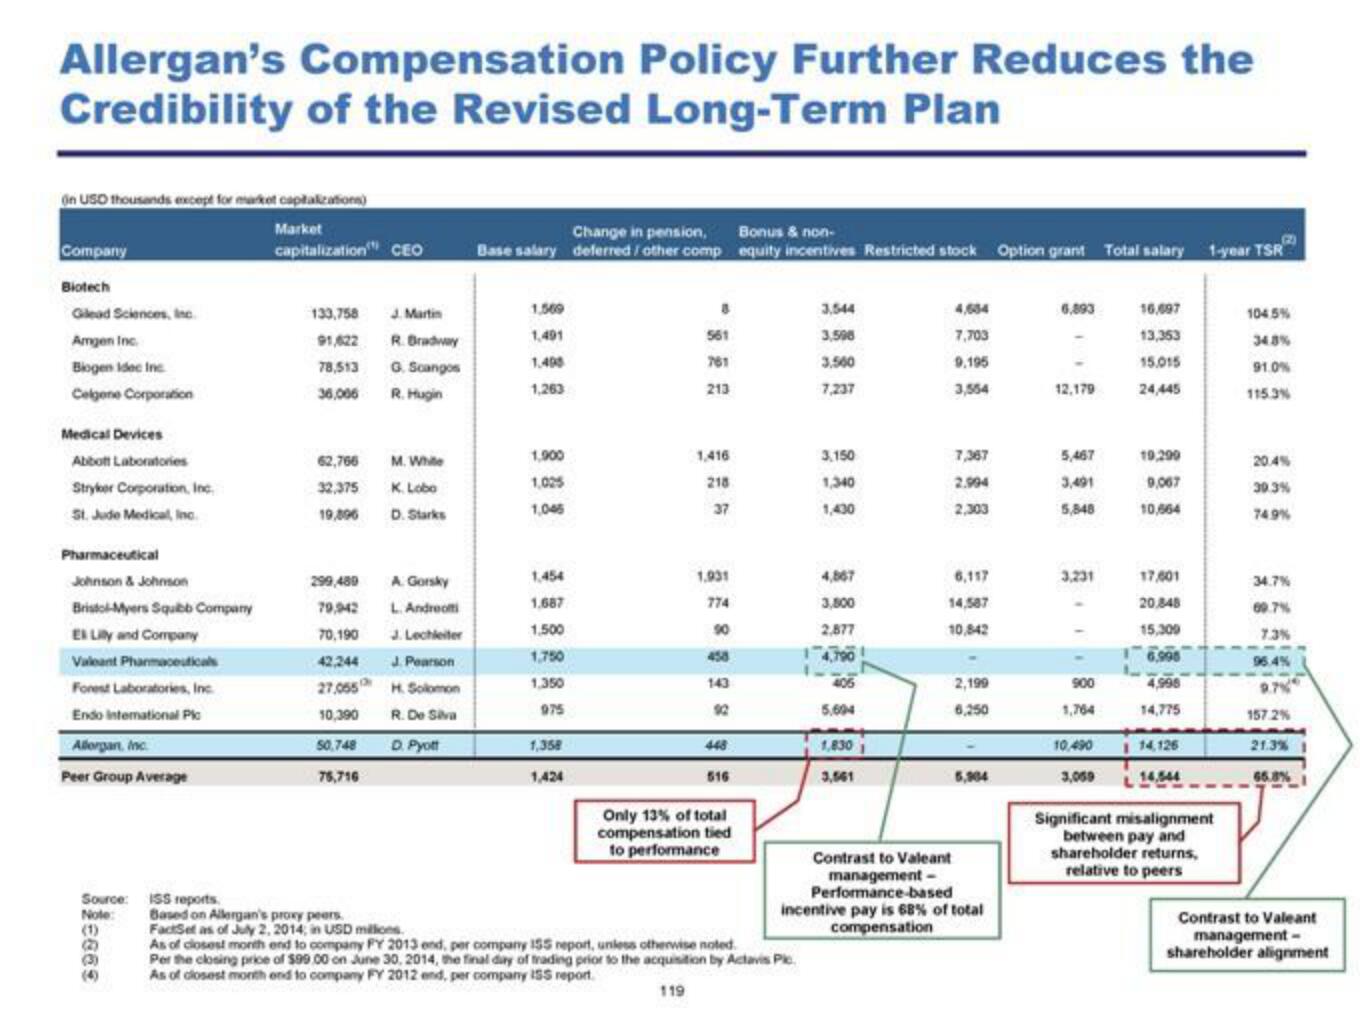
Allergan's Compensation Policy Further Reduces the
Credibility of the Revised Long-Term Plan
on USD thousands except for market capitalizations)
Market
capitalization CEO
Company
Biotech
Gilead Sciences, Inc.
Amgen Inc.
Biogen Idec Inc
Celgene Corporation
Medical Devices
Abbott Laboratories
Stryker Corporation, Inc.
St. Jude Medical, Inc.
Pharmaceutical
Johnson & Johnson
Bristol-Myers Squibb Company
El Lily and Company
valeant Pharmaceuticals
Forest Laboratories, Inc.
Endo international Pic
Allorgan, Inc.
Peer Group Average
Source: ISS reports.
leses
Note:
(3)
133,758
91,622
78,513
36,006
62,766
32,375
19,096
299,489
79,942
70,190
42,244
27,055
10,390
50,748
76,716
J. Martin
R.Bradway
G. Scangos
R. Hugin
M. While
K. Lobo
D. Starks
A Gorsky
L. Andreotti
J. Lechleiter
J. Pearson
H. Solomon
R. De Siva
D. Pyott
Based on Allergan's proxy peers.
FactSet as of July 2, 2014 in USD millions.
Change in pension,
Base salary deferred / other comp
1,569
1,491
1,490
1,263
1,900
1,025
1,045
1,454
1.687
1.500
1,750
1.350
975
1,358
1,424
561
761
213
1,416
218
37
1,931
774
90
458
143
92
448
516
Only 13% of total
compensation tied
to performance
Bonus & non-
B
equity incentives Restricted stock Option grant Total salary 1-year TSR
3,544
3,598
3,560
7,237
As of closest month end to company FY 2013 end, per company 155 report, unless otherwise noted.
Per the closing price of $99.00 on June 30, 2014, the final day of trading prior to the acquisition by Actavis Plc.
As of closest month end to company FY 2012 end, per company ISS report.
119
3,150
1,340
1,430
4,867
3,800
2,877
14,790
406
5,604
1,8301
3,561
4,604
7,703
9.195
3,554
7,367
2.994
2,303
6,117
14,587
10,842
2,199
6,250
Contrast to Valeant
management-
Performance-based
incentive pay is 68% of total
compensation
6,893
12,179
5,467
3,491
5,848
3,231
-
900
1,764
10,490
3,059
16,097
13,353
15.015
24,445
19,290
9,067
10,664
17,601
20,848
15,309
6.998
4,998
14,775
114,126
14,544
Significant misalignment
between pay and
shareholder returns,
relative to peers
104.5%
34.8%
91.0%
115.3%
20.4%
39.3%
74.9%
34.7%
69.7%
7.3%
96.4%
9.7%
157.2%
21.3%
66.8%
Contrast to Valeant
management -
shareholder alignmentView entire presentation