Faraday Future SPAC Presentation Deck
Profitability
Key commentary
Targeting 30%+ contribution margin across FF Series and 20%+
contribution margin for Smart Last Mile Delivery
Significant investment completed at Hanford manufacturing
facility and flexibility provided by contract manufacturing
Executable BoM reduction plan as business scales in 2023E & 2024E
Reduction in outsourced material costs as FF 91 and FF 81
volumes ramp, as well as alternate-sourcing of components
-
-
-
-
-
-
Additional scale benefits for key component costs from Smart
Last Mile Delivery volumes
Profitability and positive cash-flow expected to be achieved in 2024E
FF Series volumes support operations at scale
Capex will primarily fund additional capacity expansion, vendor
tooling needs and investments in Sales and After-Sales centers
-
Fully leveraged benefits of VPA for FF 81 and FF 71
development and shared BoM costs
Source:
Note:
Ⓒ2021 FARADAY FUTURE
Carryover and carryback cost benefits for both interior and body
design and materials
Planned industry standard improvements in costs from
commercial reductions and supply chain efficiencies
Faraday Future financial model are management estimates only.
Financial projections assume transaction close in Q1 2021.
40
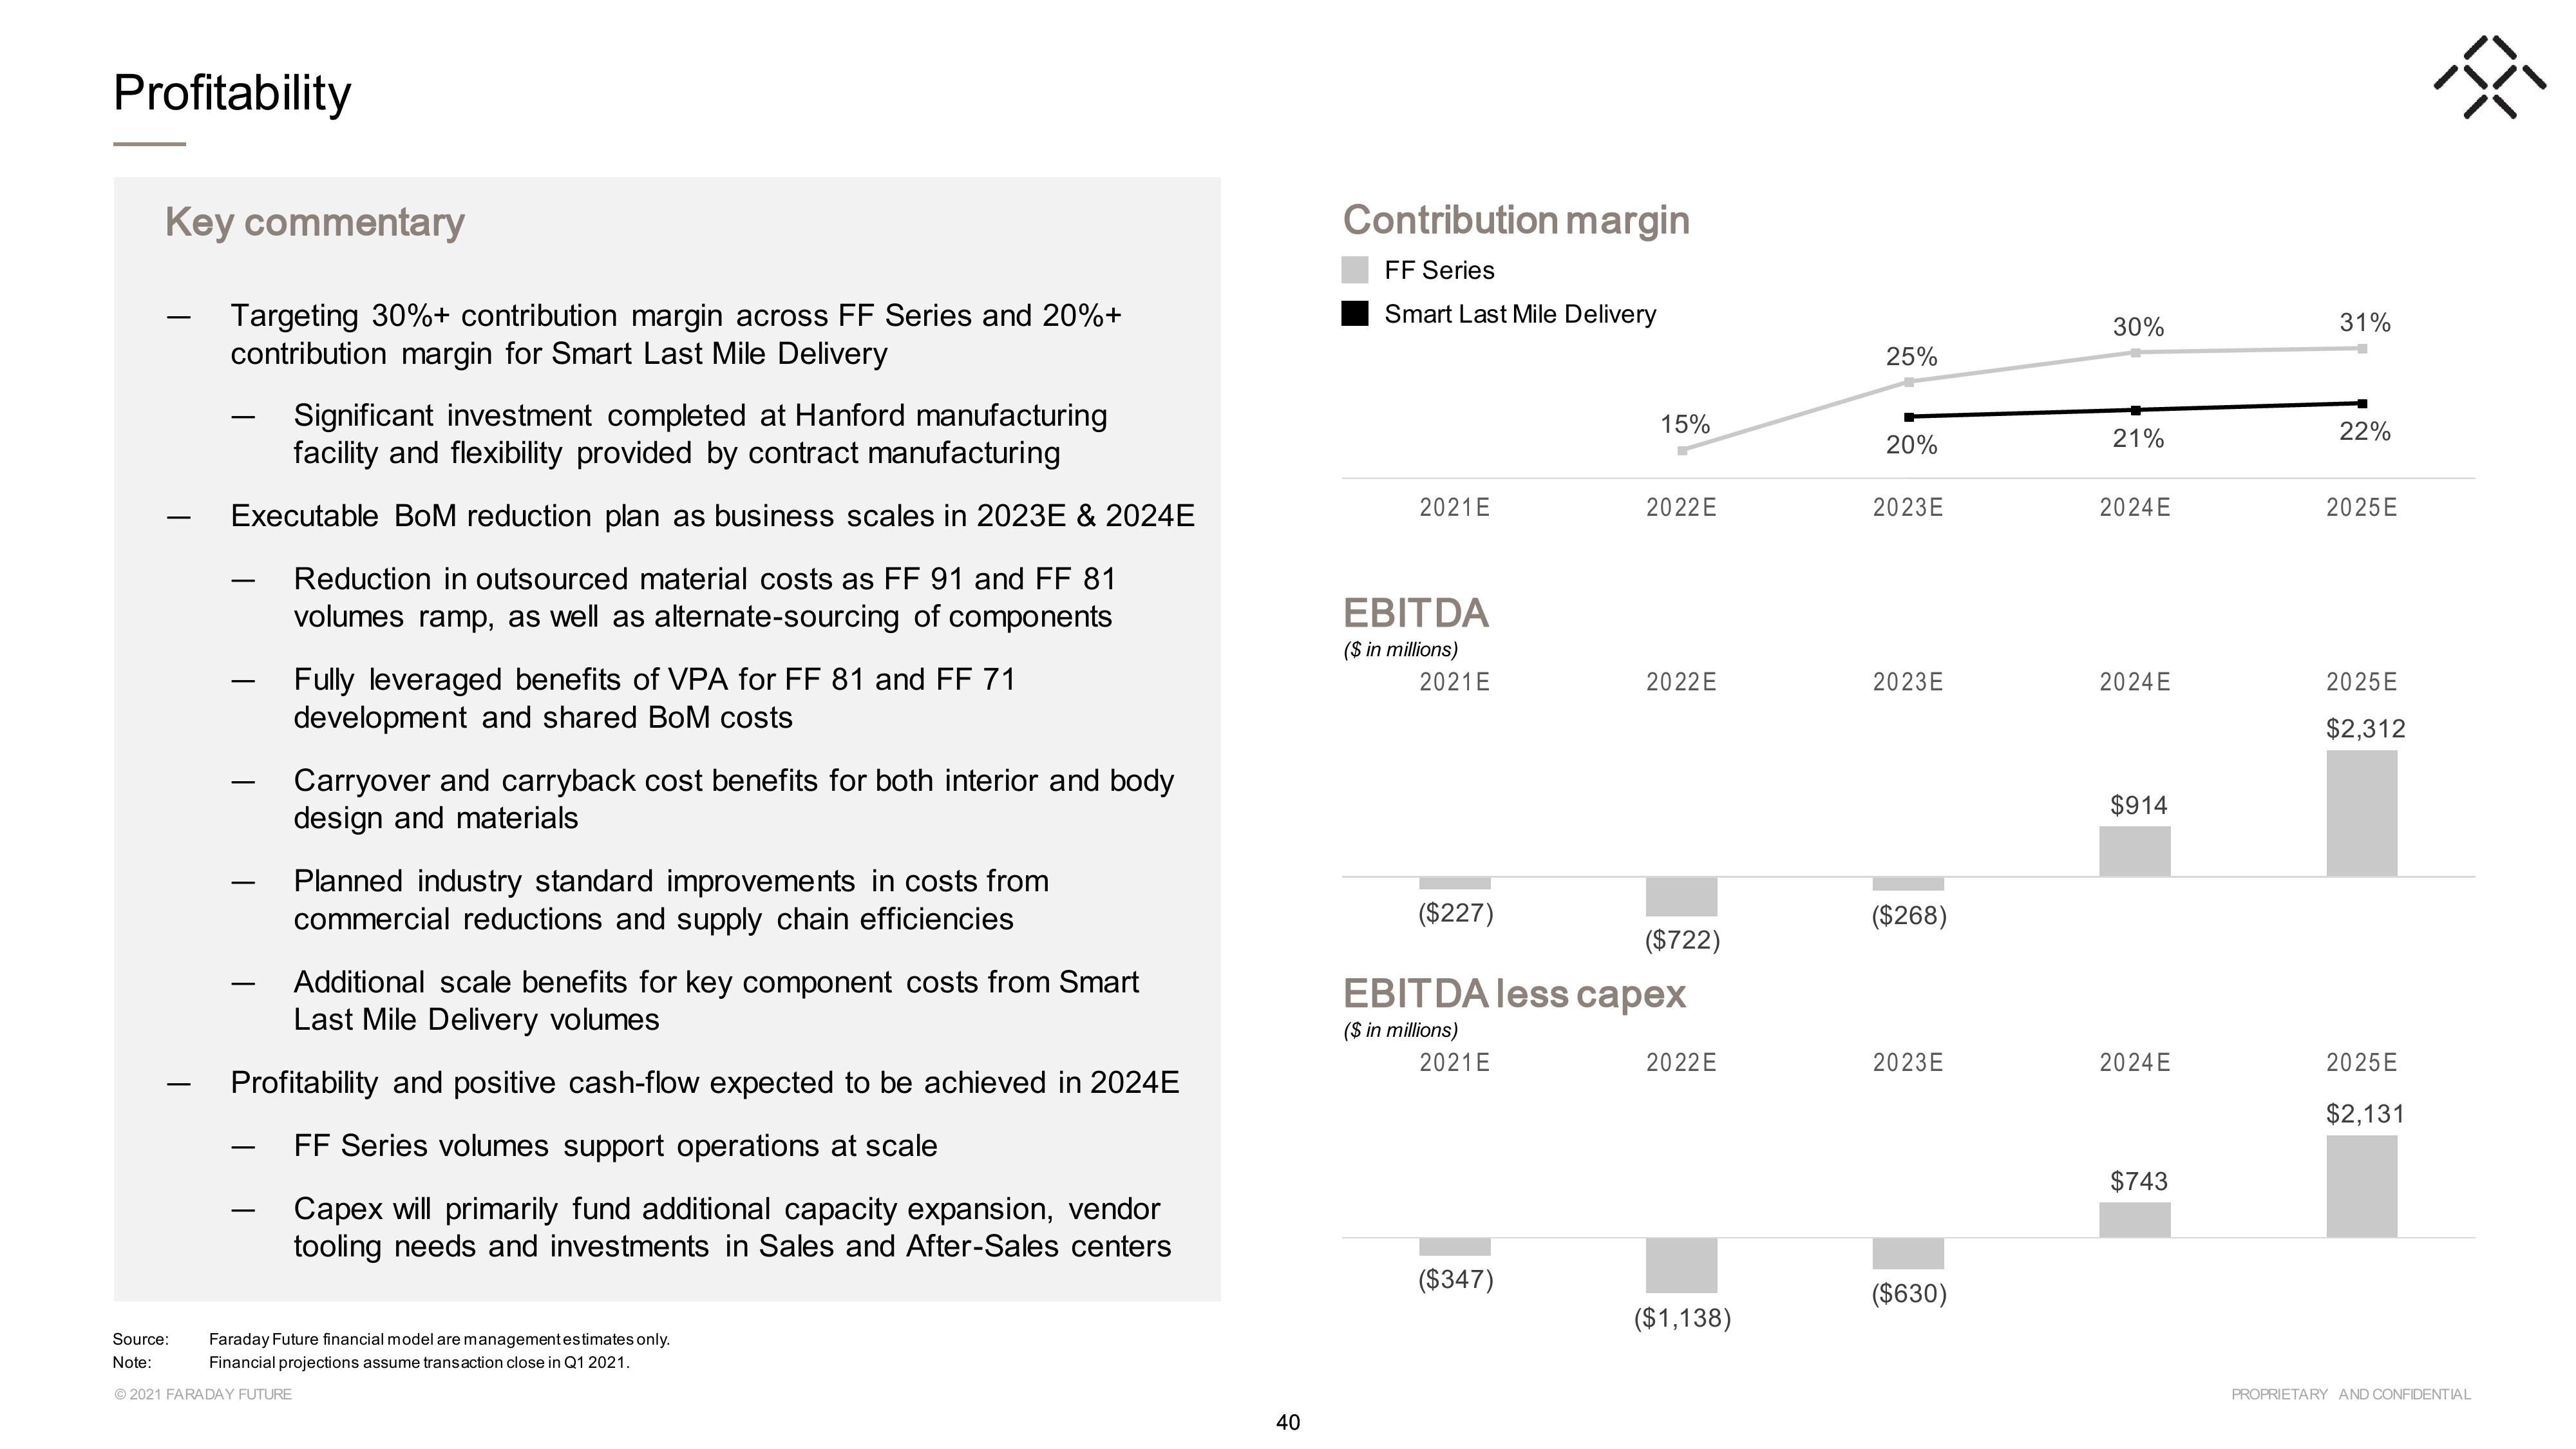
Contribution margin
FF Series
Smart Last Mile Delivery
2021 E
EBITDA
($ in millions)
2021 E
($227)
2021 E
15%
($347)
2022E
2022E
EBITDA less capex
($ in millions)
($722)
2022E
($1,138)
25%
20%
2023E
2023E
($268)
2023E
($630)
30%
21%
2024E
2024E
$914
2024E
$743
31%
22%
2025E
2025E
$2,312
2025E
$2,131
38
PROPRIETARY AND CONFIDENTIALView entire presentation