Overstock Results Presentation Deck
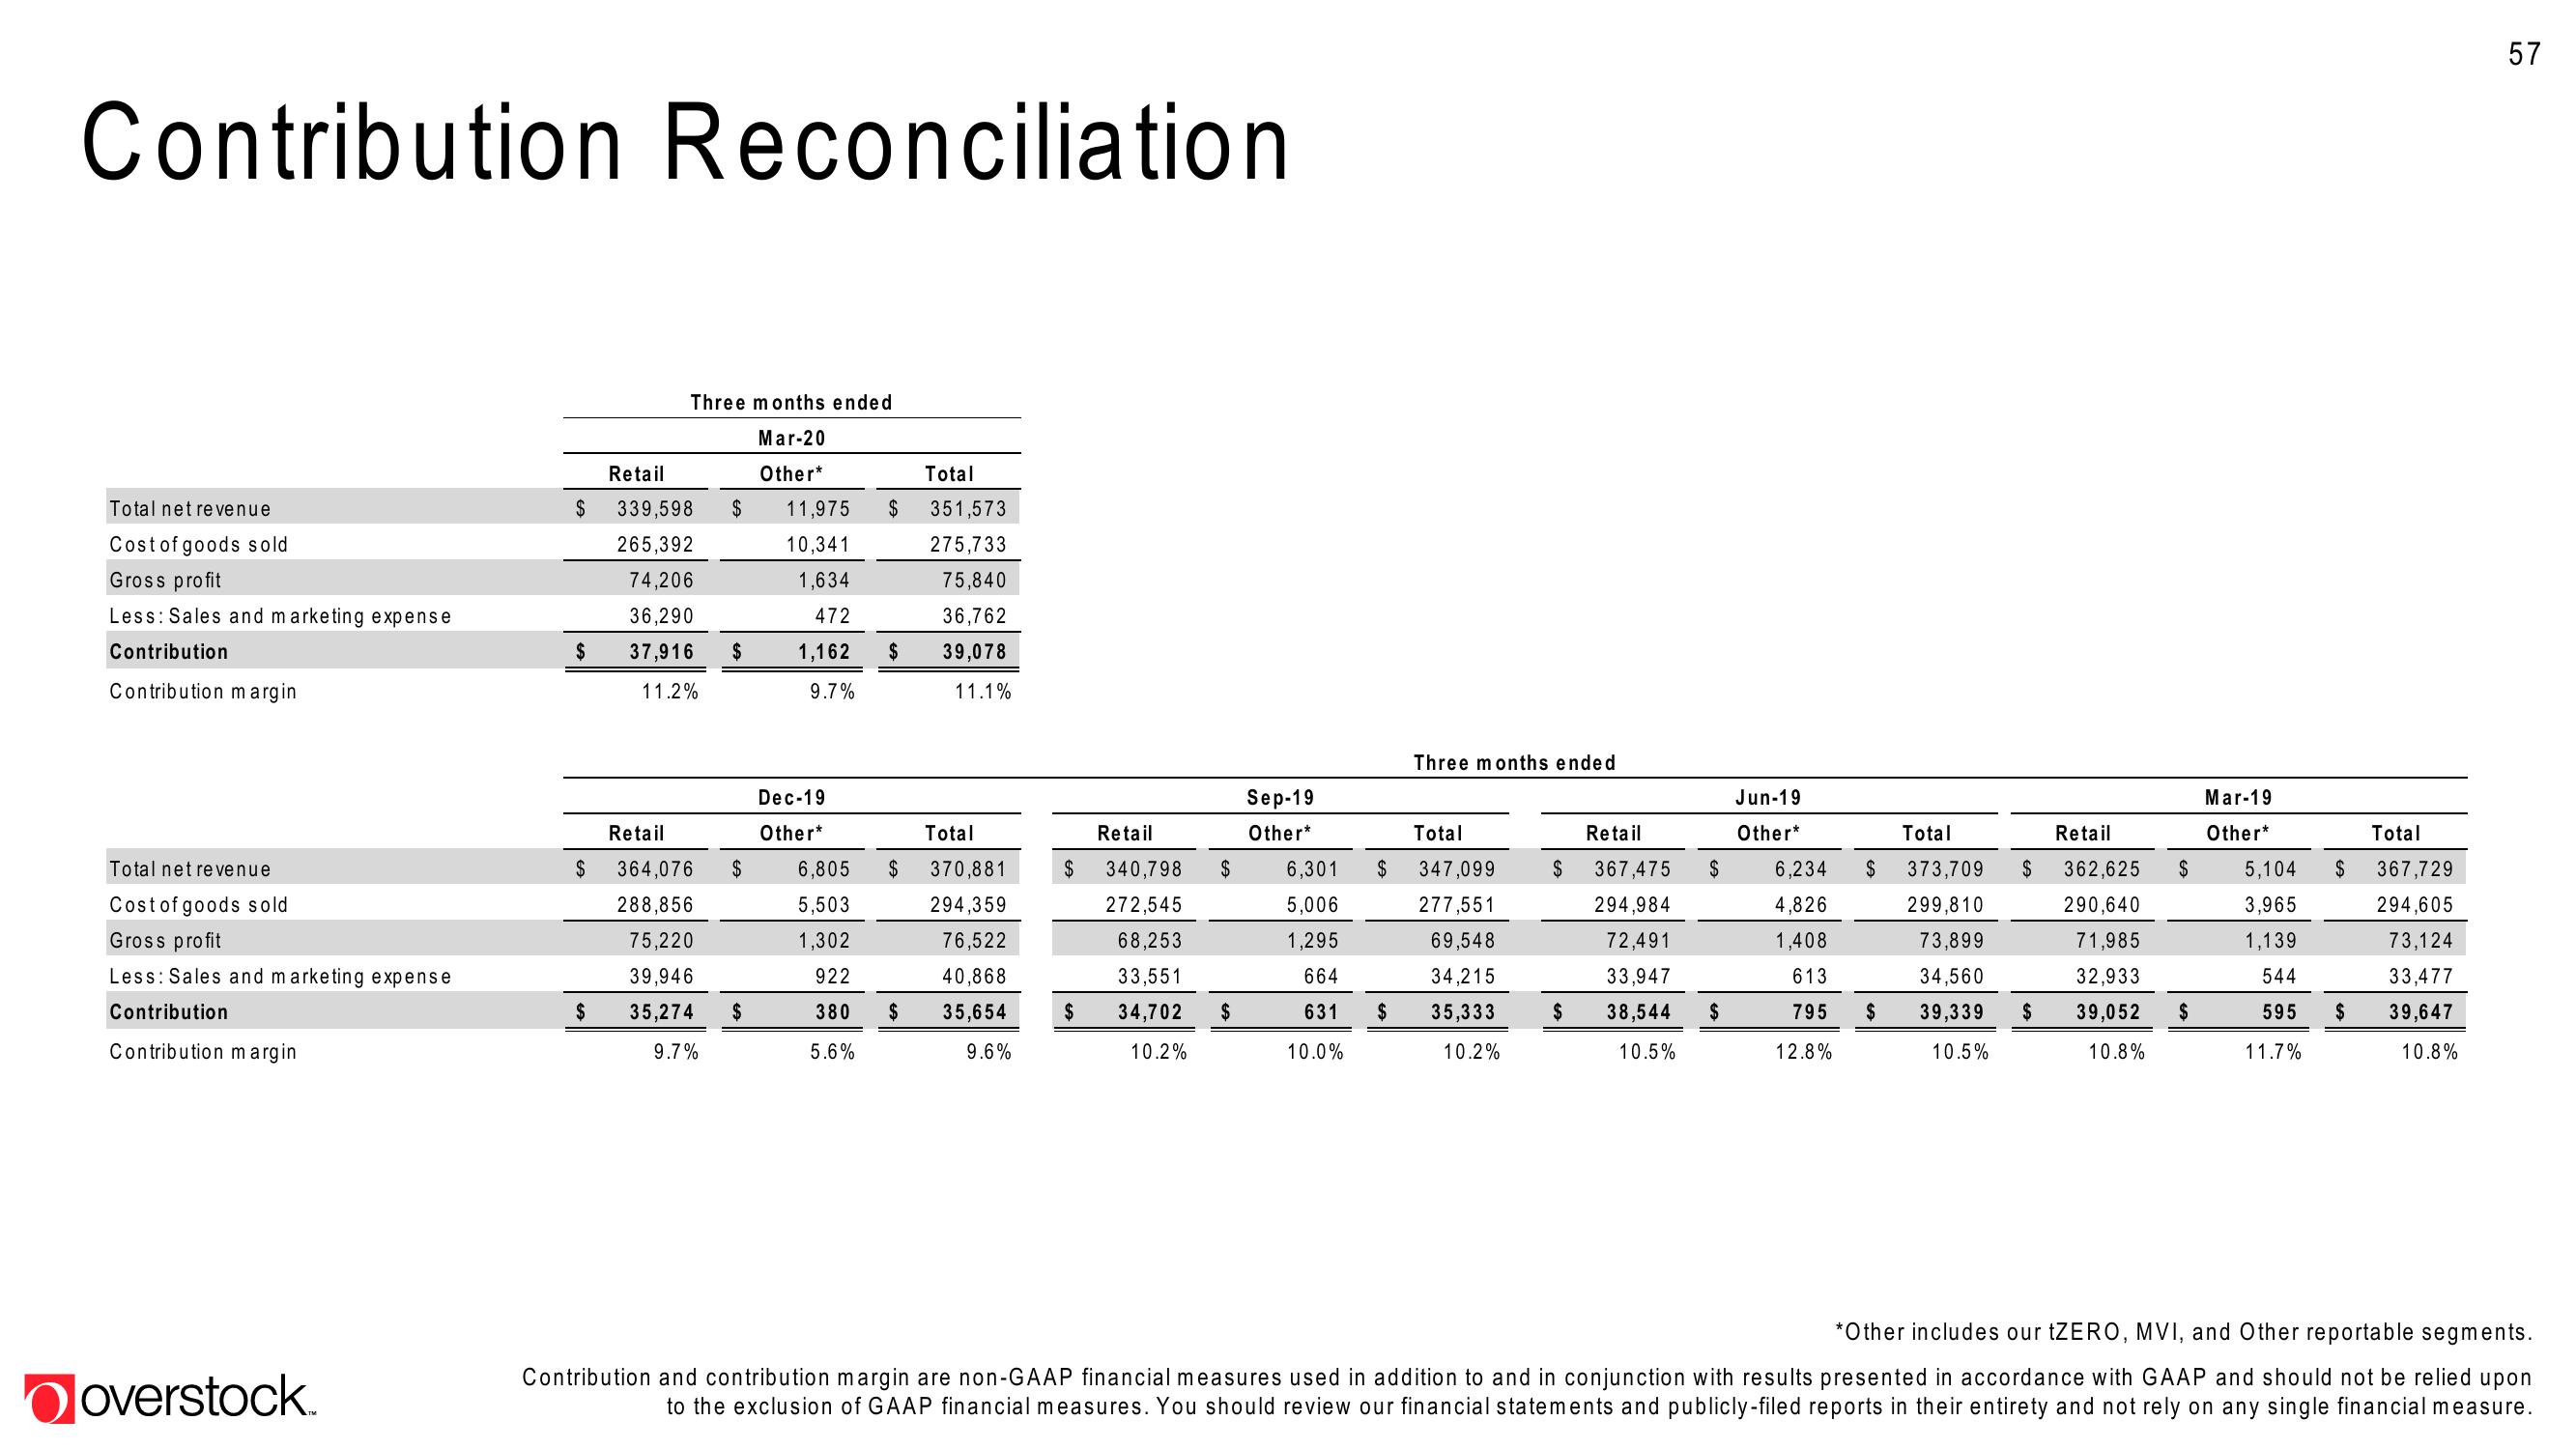
Contribution Reconciliation
Total net revenue
Cost of goods sold
Gross profit
Less: Sales and marketing expense
Contribution
Contribution margin
Total net revenue
Cost of goods sold
Gross profit
Less: Sales and marketing expense
Contribution
Contribution margin
overstock.
$
$
$
$
Three months ended
Mar-20
Other*
Retail
339,598 $
265,392
74,206
36,290
37,916
11.2%
Retail
$
364,076
288,856
75,220
39,946
35,274 $
9.7%
$
11,975
10,341
1,634
472
1,162
9.7%
Dec-19
Other*
6,805
5,503
1,302
922
380
5.6%
$
$
$
$
Total
351,573
275,733
75,840
36,762
39,078
11.1%
Total
370,881
294,359
76,522
40,868
35,654
9.6%
$
$
Retail
340,798 $
272,545
68,253
33,551
34,702
10.2%
$
Sep-19
Other*
6,301
5,006
1,295
664
631
10.0%
$
$
Three months ended
Total
347,099
277,551
69,548
34,215
35,333
10.2%
$
$
Retail
367,475
294,984
72,491
33,947
38,544
10.5%
$
$
Jun-19
Other*
6,234 $
4,826
1,408
613
795
12.8%
$
Total
373,709
299,810
73,899
34,560
39,339
10.5%
$
$
Retail
362,625
290,640
71,985
32,933
$
39,052 $
10.8%
Mar-19
Other*
5,104 $
3,965
1,139
544
595
11.7%
$
Total
367,729
294,605
73,124
33,477
39,647
10.8%
57
*Other includes our tZERO, MVI, and Other reportable segments.
Contribution and contribution margin are non-GAAP financial measures used in addition to and in conjunction with results presented in accordance with GAAP and should not be relied upon
to the exclusion of GAAP financial measures. You should review our financial statements and publicly-filed reports in their entirety and not rely on any single financial measure.View entire presentation