Marti Investor Presentation Deck
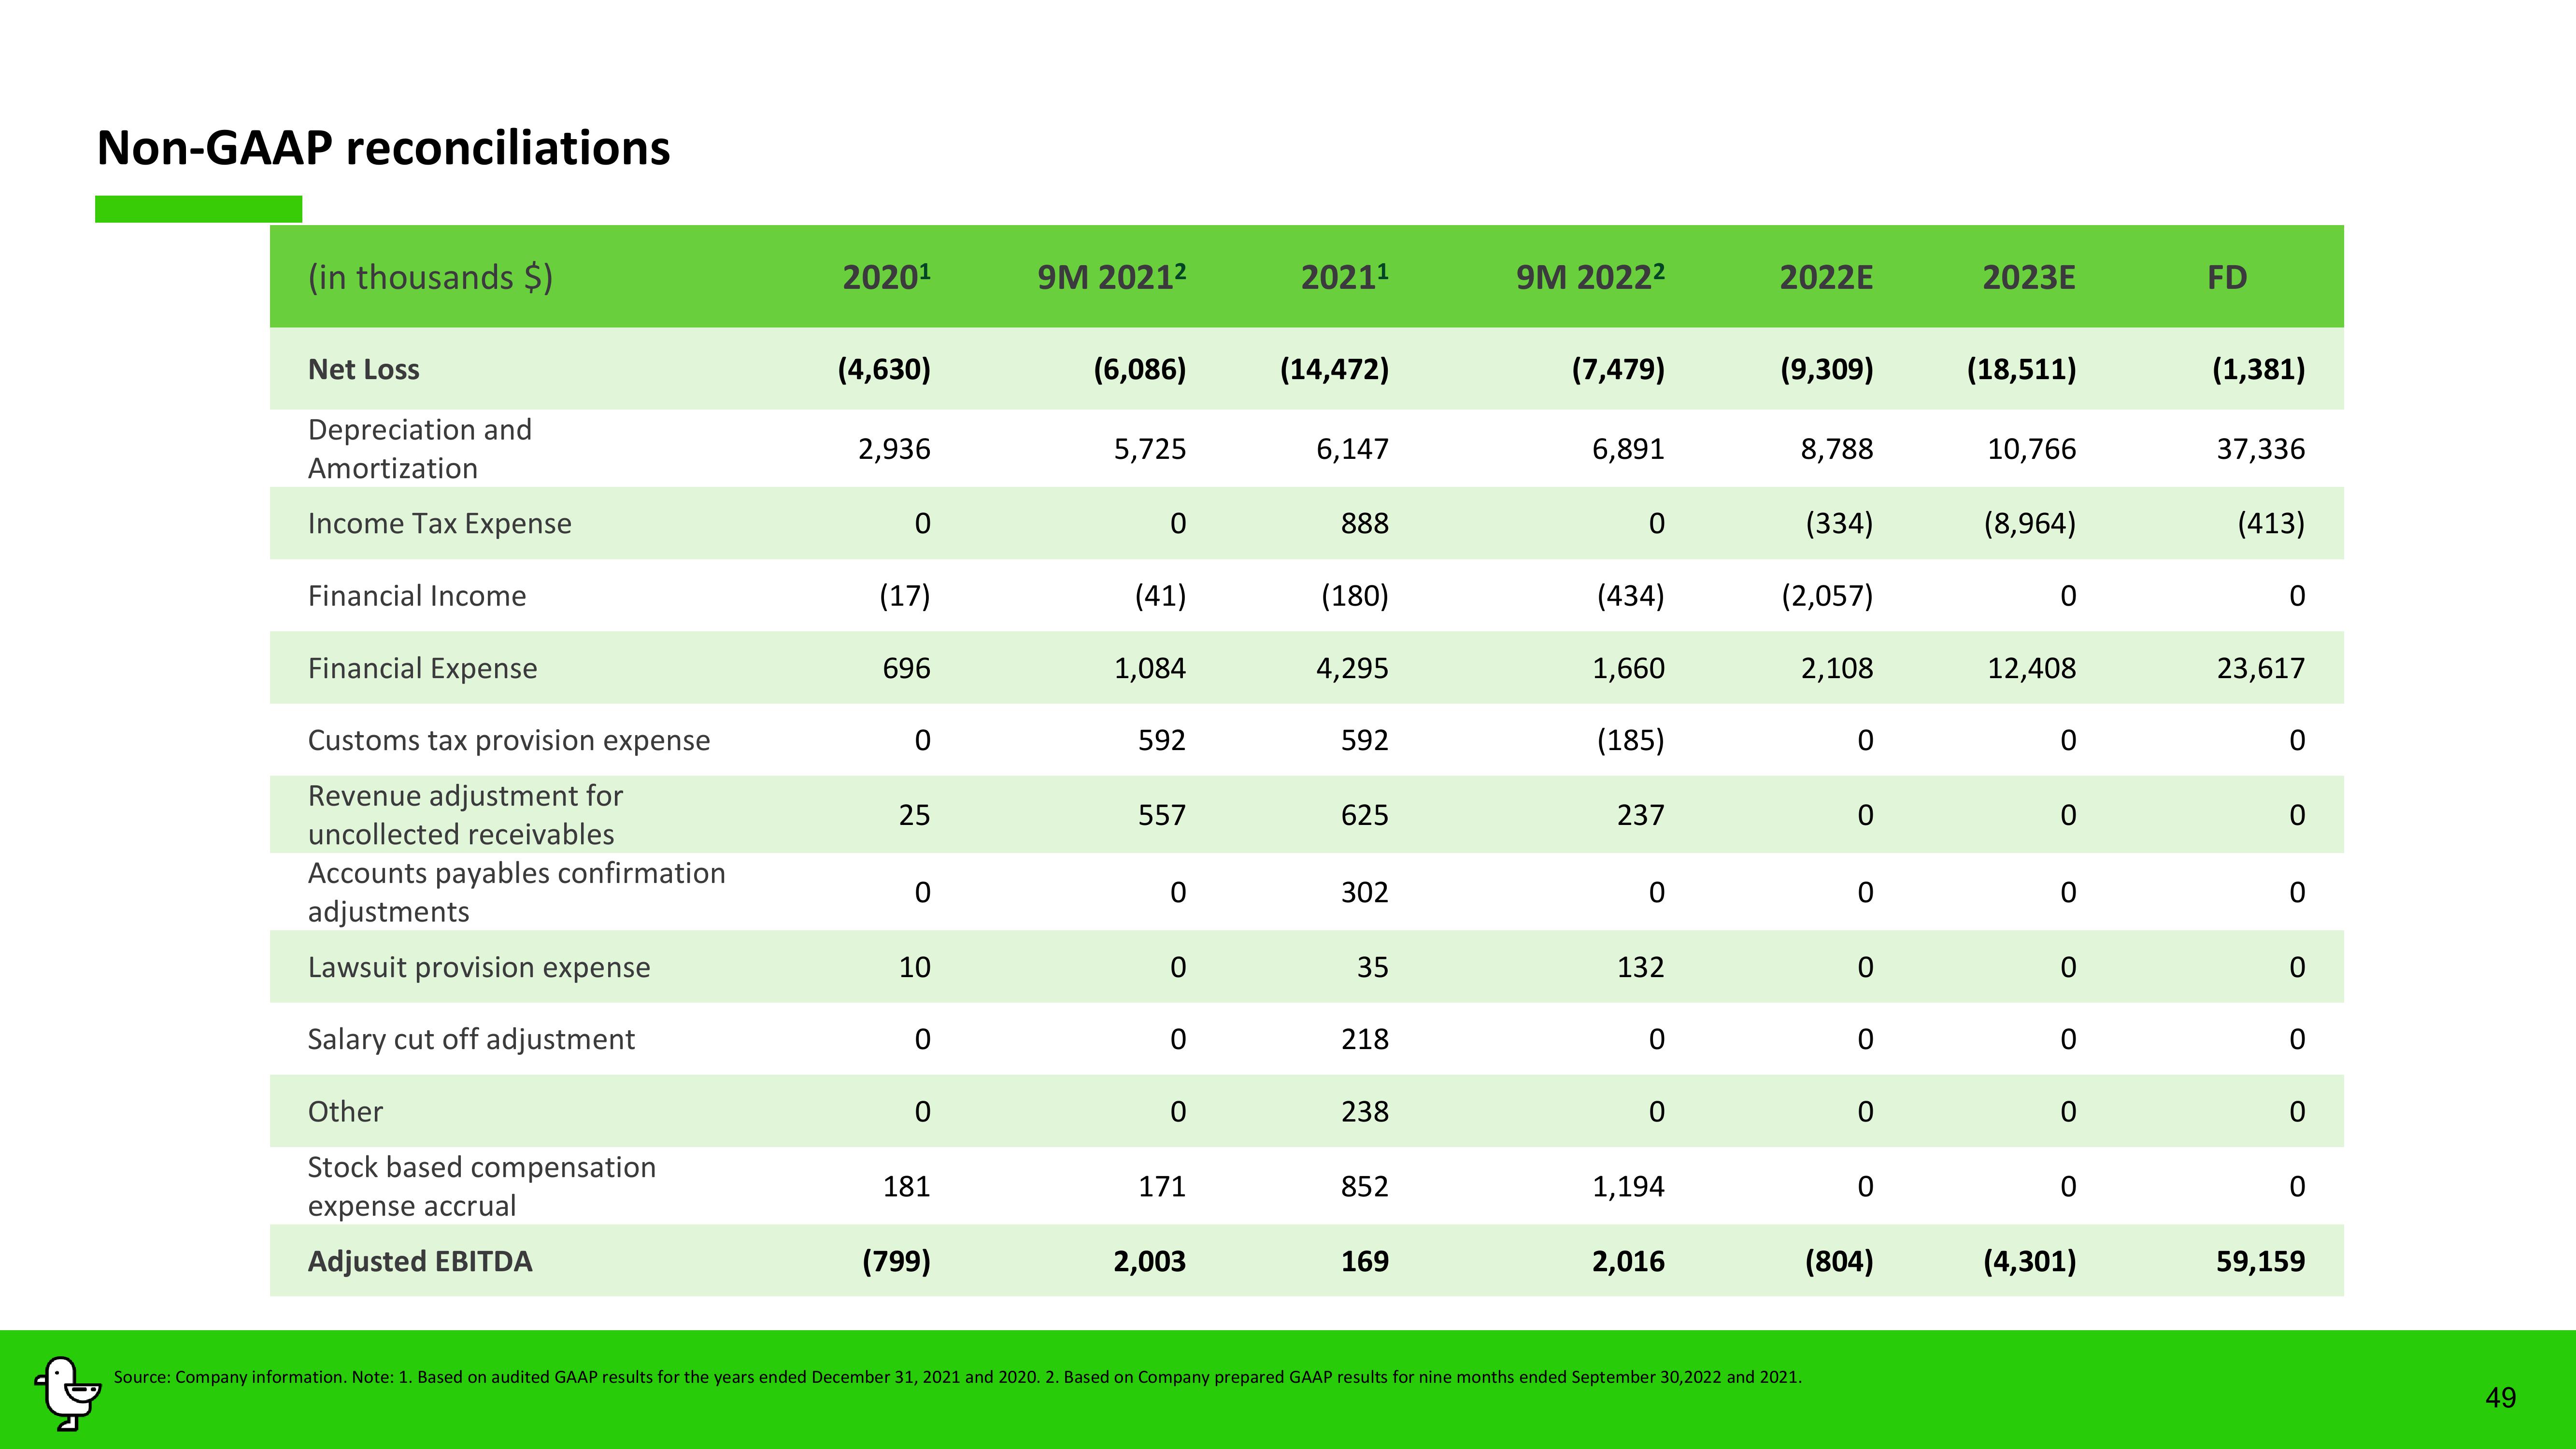
Non-GAAP reconciliations
(in thousands $)
Net Loss
Depreciation and
Amortization
Income Tax Expense
Financial Income
Financial Expense
Customs tax provision expense
Revenue adjustment for
uncollected receivables
Accounts payables confirmation
adjustments
Lawsuit provision expense
Salary cut off adjustment
Other
Stock based compensation
expense accrual
Adjusted EBITDA
2020¹
(4,630)
2,936
0
(17)
696
0
25
0
10
0
0
181
(799)
9M 2021²
(6,086)
5,725
0
(41)
1,084
592
557
0
0
0
0
171
2,003
2021¹
(14,472)
6,147
888
(180)
4,295
592
625
302
35
218
238
852
169
9M 2022²
(7,479)
6,891
0
(434)
1,660
(185)
237
0
132
0
0
1,194
2,016
2022E
(9,309)
8,788
(334)
(2,057)
2,108
Source: Company information. Note: 1. Based on audited GAAP results for the years ended December 31, 2021 and 2020. 2. Based on Company prepared GAAP results for nine months ended September 30,2022 and 2021.
0
0
0
0
0
0
0
(804)
2023E
(18,511)
10,766
(8,964)
0
12,408
0
0
0
0
0
0
0
(4,301)
FD
(1,381)
37,336
(413)
0
23,617
0
0
0
0
0
0
0
59,159
49View entire presentation