Truist Financial Corp Results Presentation Deck
Noninterest income
$2,365
$772
$276
$356
$316
$645
42.2%
3Q21
$2,323
$657
$273
$350
$377
$666
41.7%
5-Quarter Trend
Other income detail
Other income (ex. NQDCP)
NQDCP impact
Other income
$2,142
$559
$252
$343
$261
$727
40.2%
4Q21
Insurance income
Wealth management income
All other fee categories
1Q22
$
$2,248
$577
$
$254
$337
$255
$825
39.7%
2Q22
3Q21
110 $
$2,102
$558
30
140 $
$263
Investment banking & trading
Service charges on deposits
Fee income ratio (%)
12:00
$334
$222
$725
36.0%
3Q22
2Q22
46 $
(30)
16 $
3Q22
29
(28)
1
-
vs. Prior Quarter
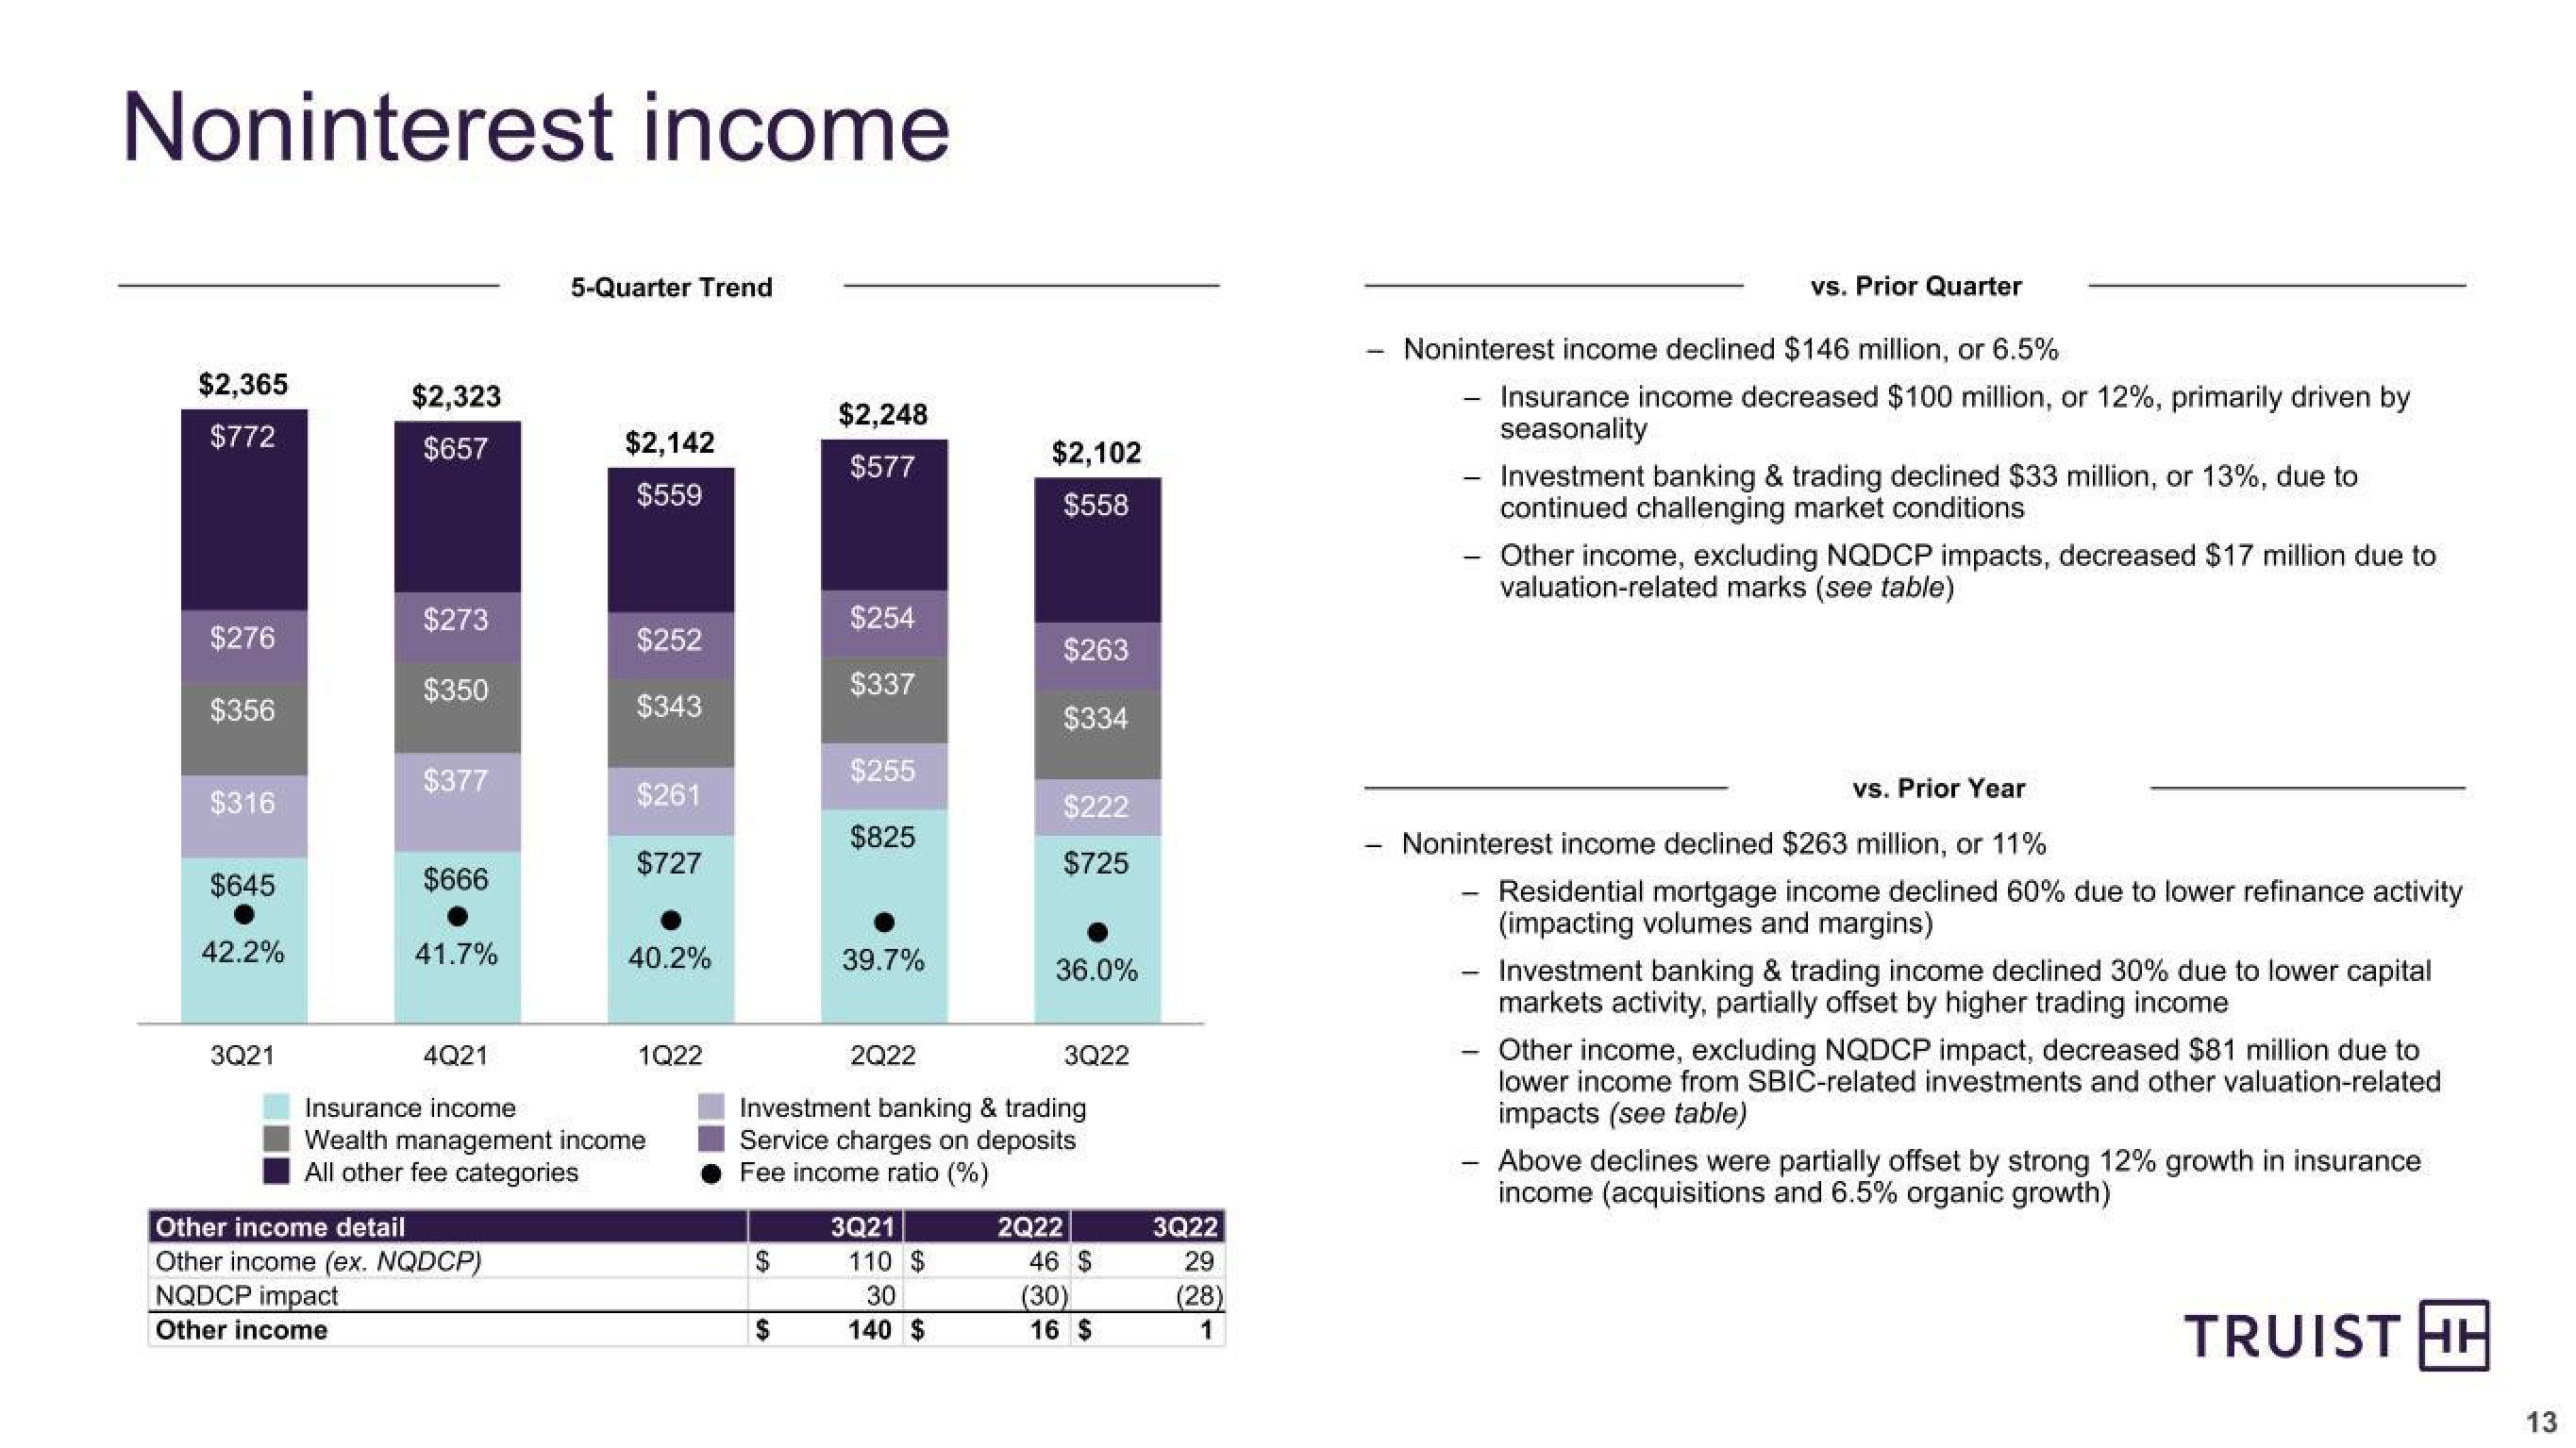
Noninterest income declined $146 million, or 6.5%
- Investment banking & trading declined $33 million, or 13%, due to
continued challenging market conditions
Insurance income decreased $100 million, or 12%, primarily driven by
seasonality
-
vs. Prior Year
Noninterest income declined $263 million, or 11%
-
Other income, excluding NQDCP impacts, decreased $17 million due to
valuation-related marks (see table)
Residential mortgage income declined 60% due to lower refinance activity
(impacting volumes and margins)
Investment banking & trading income declined 30% due to lower capital
markets activity, partially offset by higher trading income
Other income, excluding NQDCP impact, decreased $81 million due to
lower income from SBIC-related investments and other valuation-related
impacts (see table)
Above declines were partially offset by strong 12% growth in insurance
income (acquisitions and 6.5% organic growth)
TRUIST HH
13View entire presentation