Kore SPAC Presentation Deck
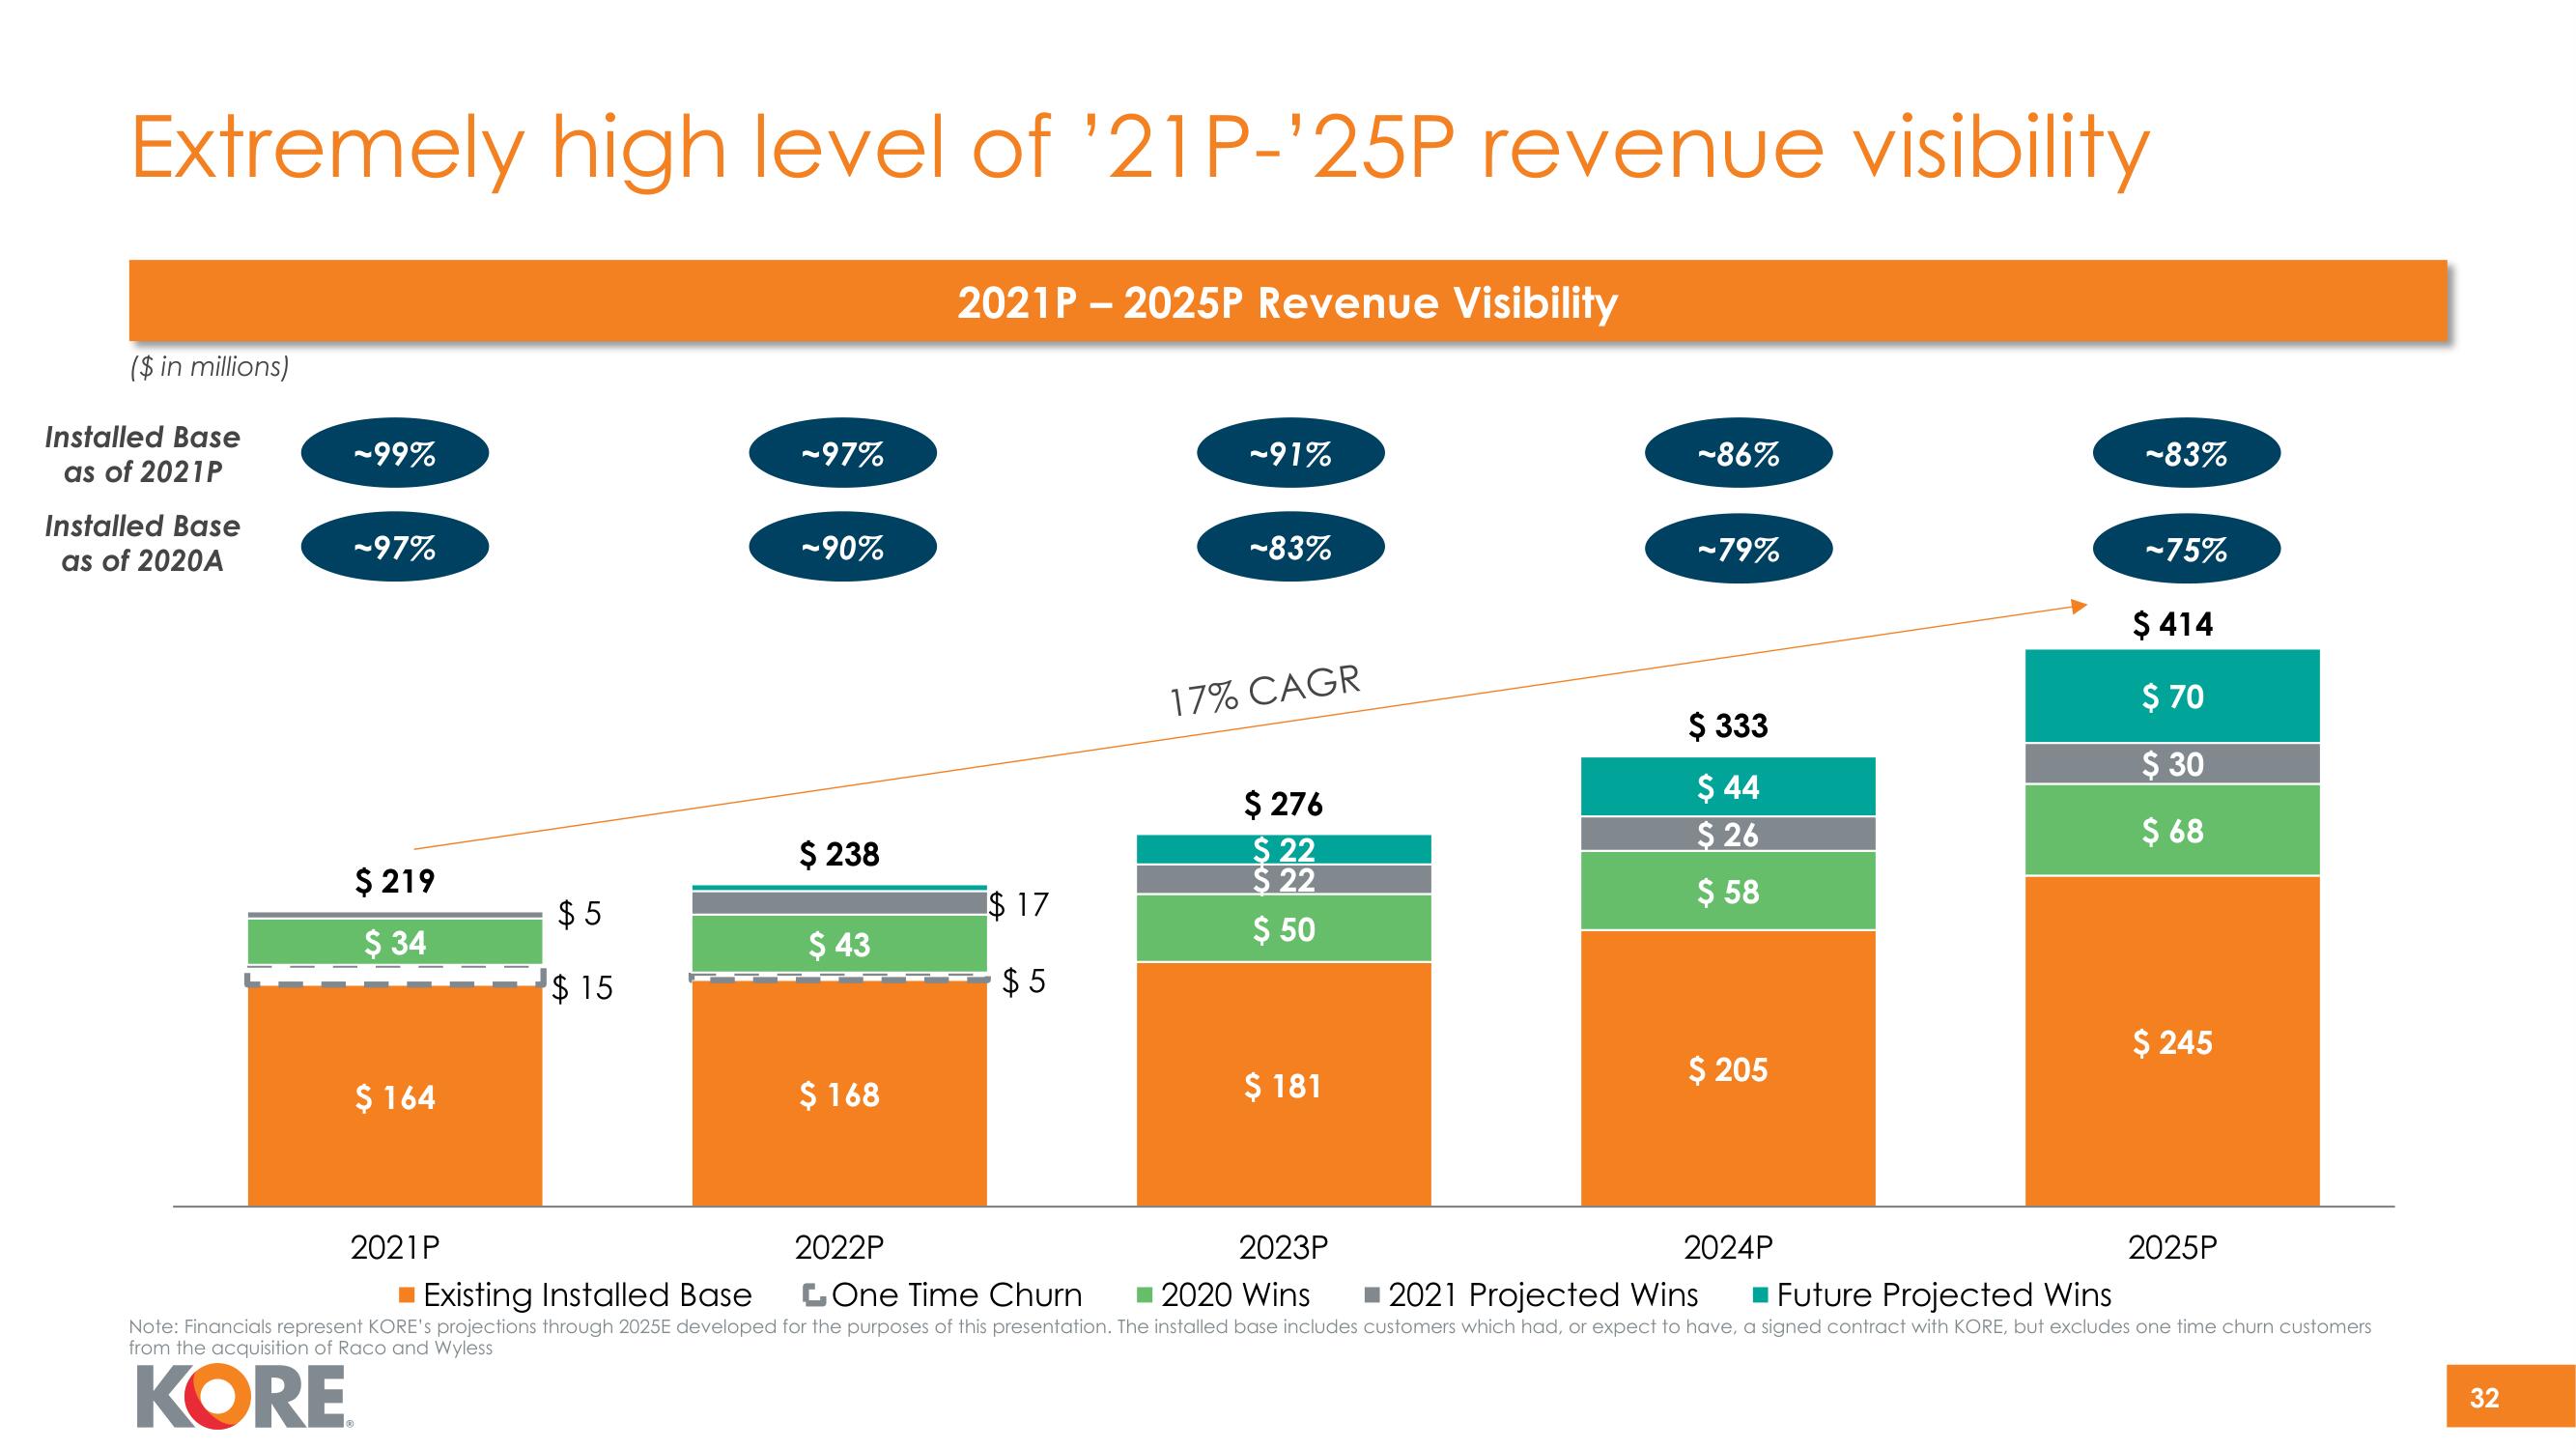
Extremely high level of '21P-'25P revenue visibility
2021P - 2025P Revenue Visibility
($ in millions)
Installed Base
as of 2021P
Installed Base
as of 2020A
~99%
-97%
$ 219
$ 34
$ 164
$5
$15
2021 P
~97%
~90%
$ 238
$ 43
$ 168
$17
$5
-91%
-83%
17% CAGR
$ 276
$22
$22
$ 50
$ 181
-86%
-79%
$ 333
$ 44
$26
$ 58
$ 205
-83%
-75%
$ 414
$ 70
$ 30
$ 68
$ 245
2022P
2024P
2023P
2020 Wins
Existing Installed Base
LOne Time Churn
■2021 Projected Wins ■ Future Projected Wins
Note: Financials represent KORE's projections through 2025E developed for the purposes of this presentation. The installed base includes customers which had, or expect to have, a signed contract with KORE, but excludes one time churn customers
from the acquisition of Raco and Wyless
KORE
2025P
32View entire presentation