Spotify Results Presentation Deck
Executive Summary
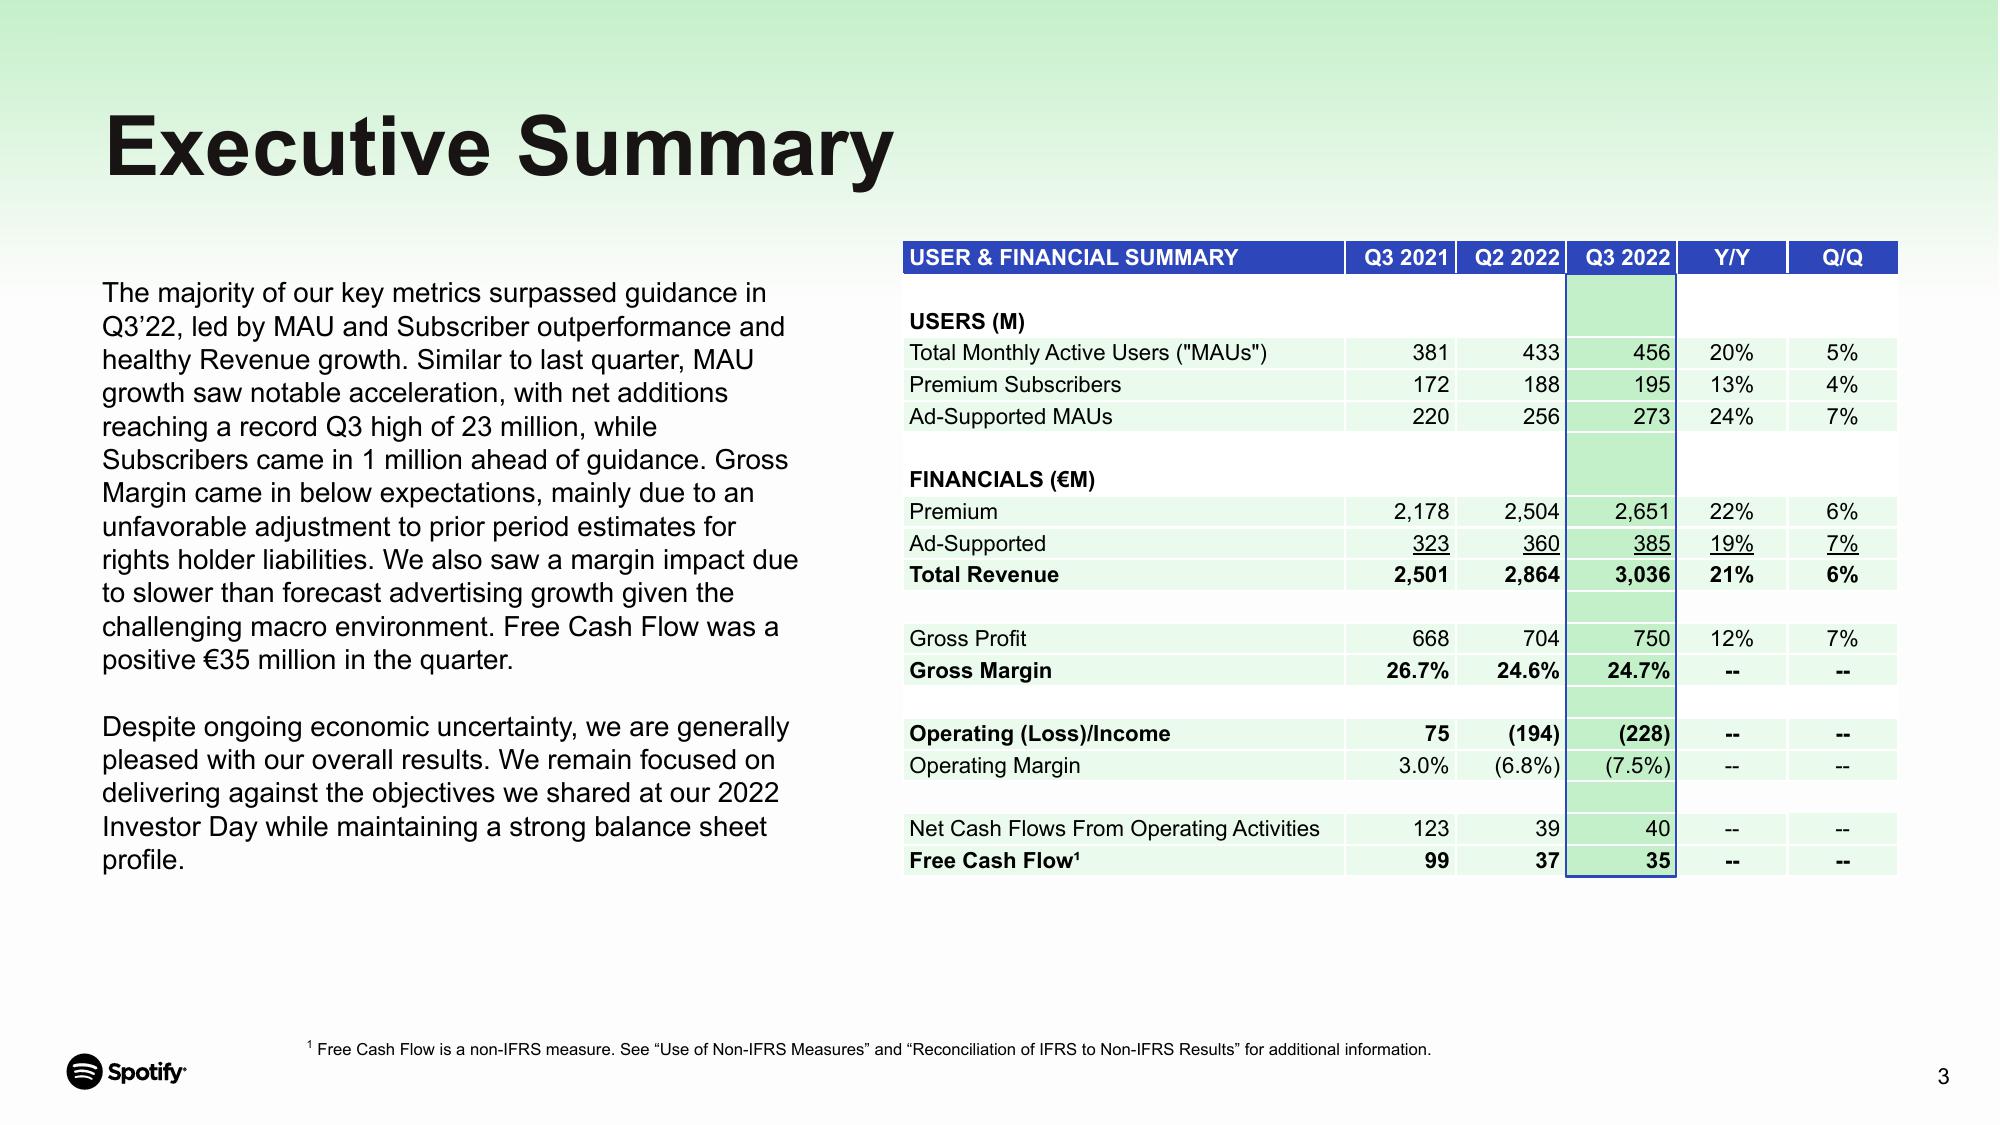
The majority of our key metrics surpassed guidance in
Q3'22, led by MAU and Subscriber outperformance and
healthy Revenue growth. Similar to last quarter, MAU
growth saw notable acceleration, with net additions
reaching a record Q3 high of 23 million, while
Subscribers came in 1 million ahead of guidance. Gross
Margin came in below expectations, mainly due to an
unfavorable adjustment to prior period estimates for
rights holder liabilities. We also saw a margin impact due
to slower than forecast advertising growth given the
challenging macro environment. Free Cash Flow was a
positive €35 million in the quarter.
Despite ongoing economic uncertainty, we are generally
pleased with our overall results. We remain focused on
delivering against the objectives we shared at our 2022
Investor Day while maintaining a strong balance sheet
profile.
Spotify
USER & FINANCIAL SUMMARY
USERS (M)
Total Monthly Active Users ("MAUS")
Premium Subscribers
Ad-Supported MAUS
FINANCIALS (€M)
Premium
Ad-Supported
Total Revenue
Gross Profit
Gross Margin
Operating (Loss)/Income
Operating Margin
Net Cash Flows From Operating Activities
Free Cash Flow¹
Q3 2021
381
172
220
2,178
323
2,501
668
26.7%
75
3.0%
123
99
1 Free Cash Flow is a non-IFRS measure. See "Use of Non-IFRS Measures" and "Reconciliation of IFRS to Non-IFRS Results" for additional information.
Q2 2022
433
188
256
2,504
360
2,864
704
24.6%
(194)
(6.8%)
39
37
Q3 2022
456
195
273
2,651
385
3,036
750
24.7%
(228)
(7.5%)
40
35
Y/Y
20%
13%
24%
22%
19%
21%
12%
--
--
11
Q/Q
5%
4%
7%
6%
7%
6%
7%
3View entire presentation