SmileDirectClub Investor Presentation Deck
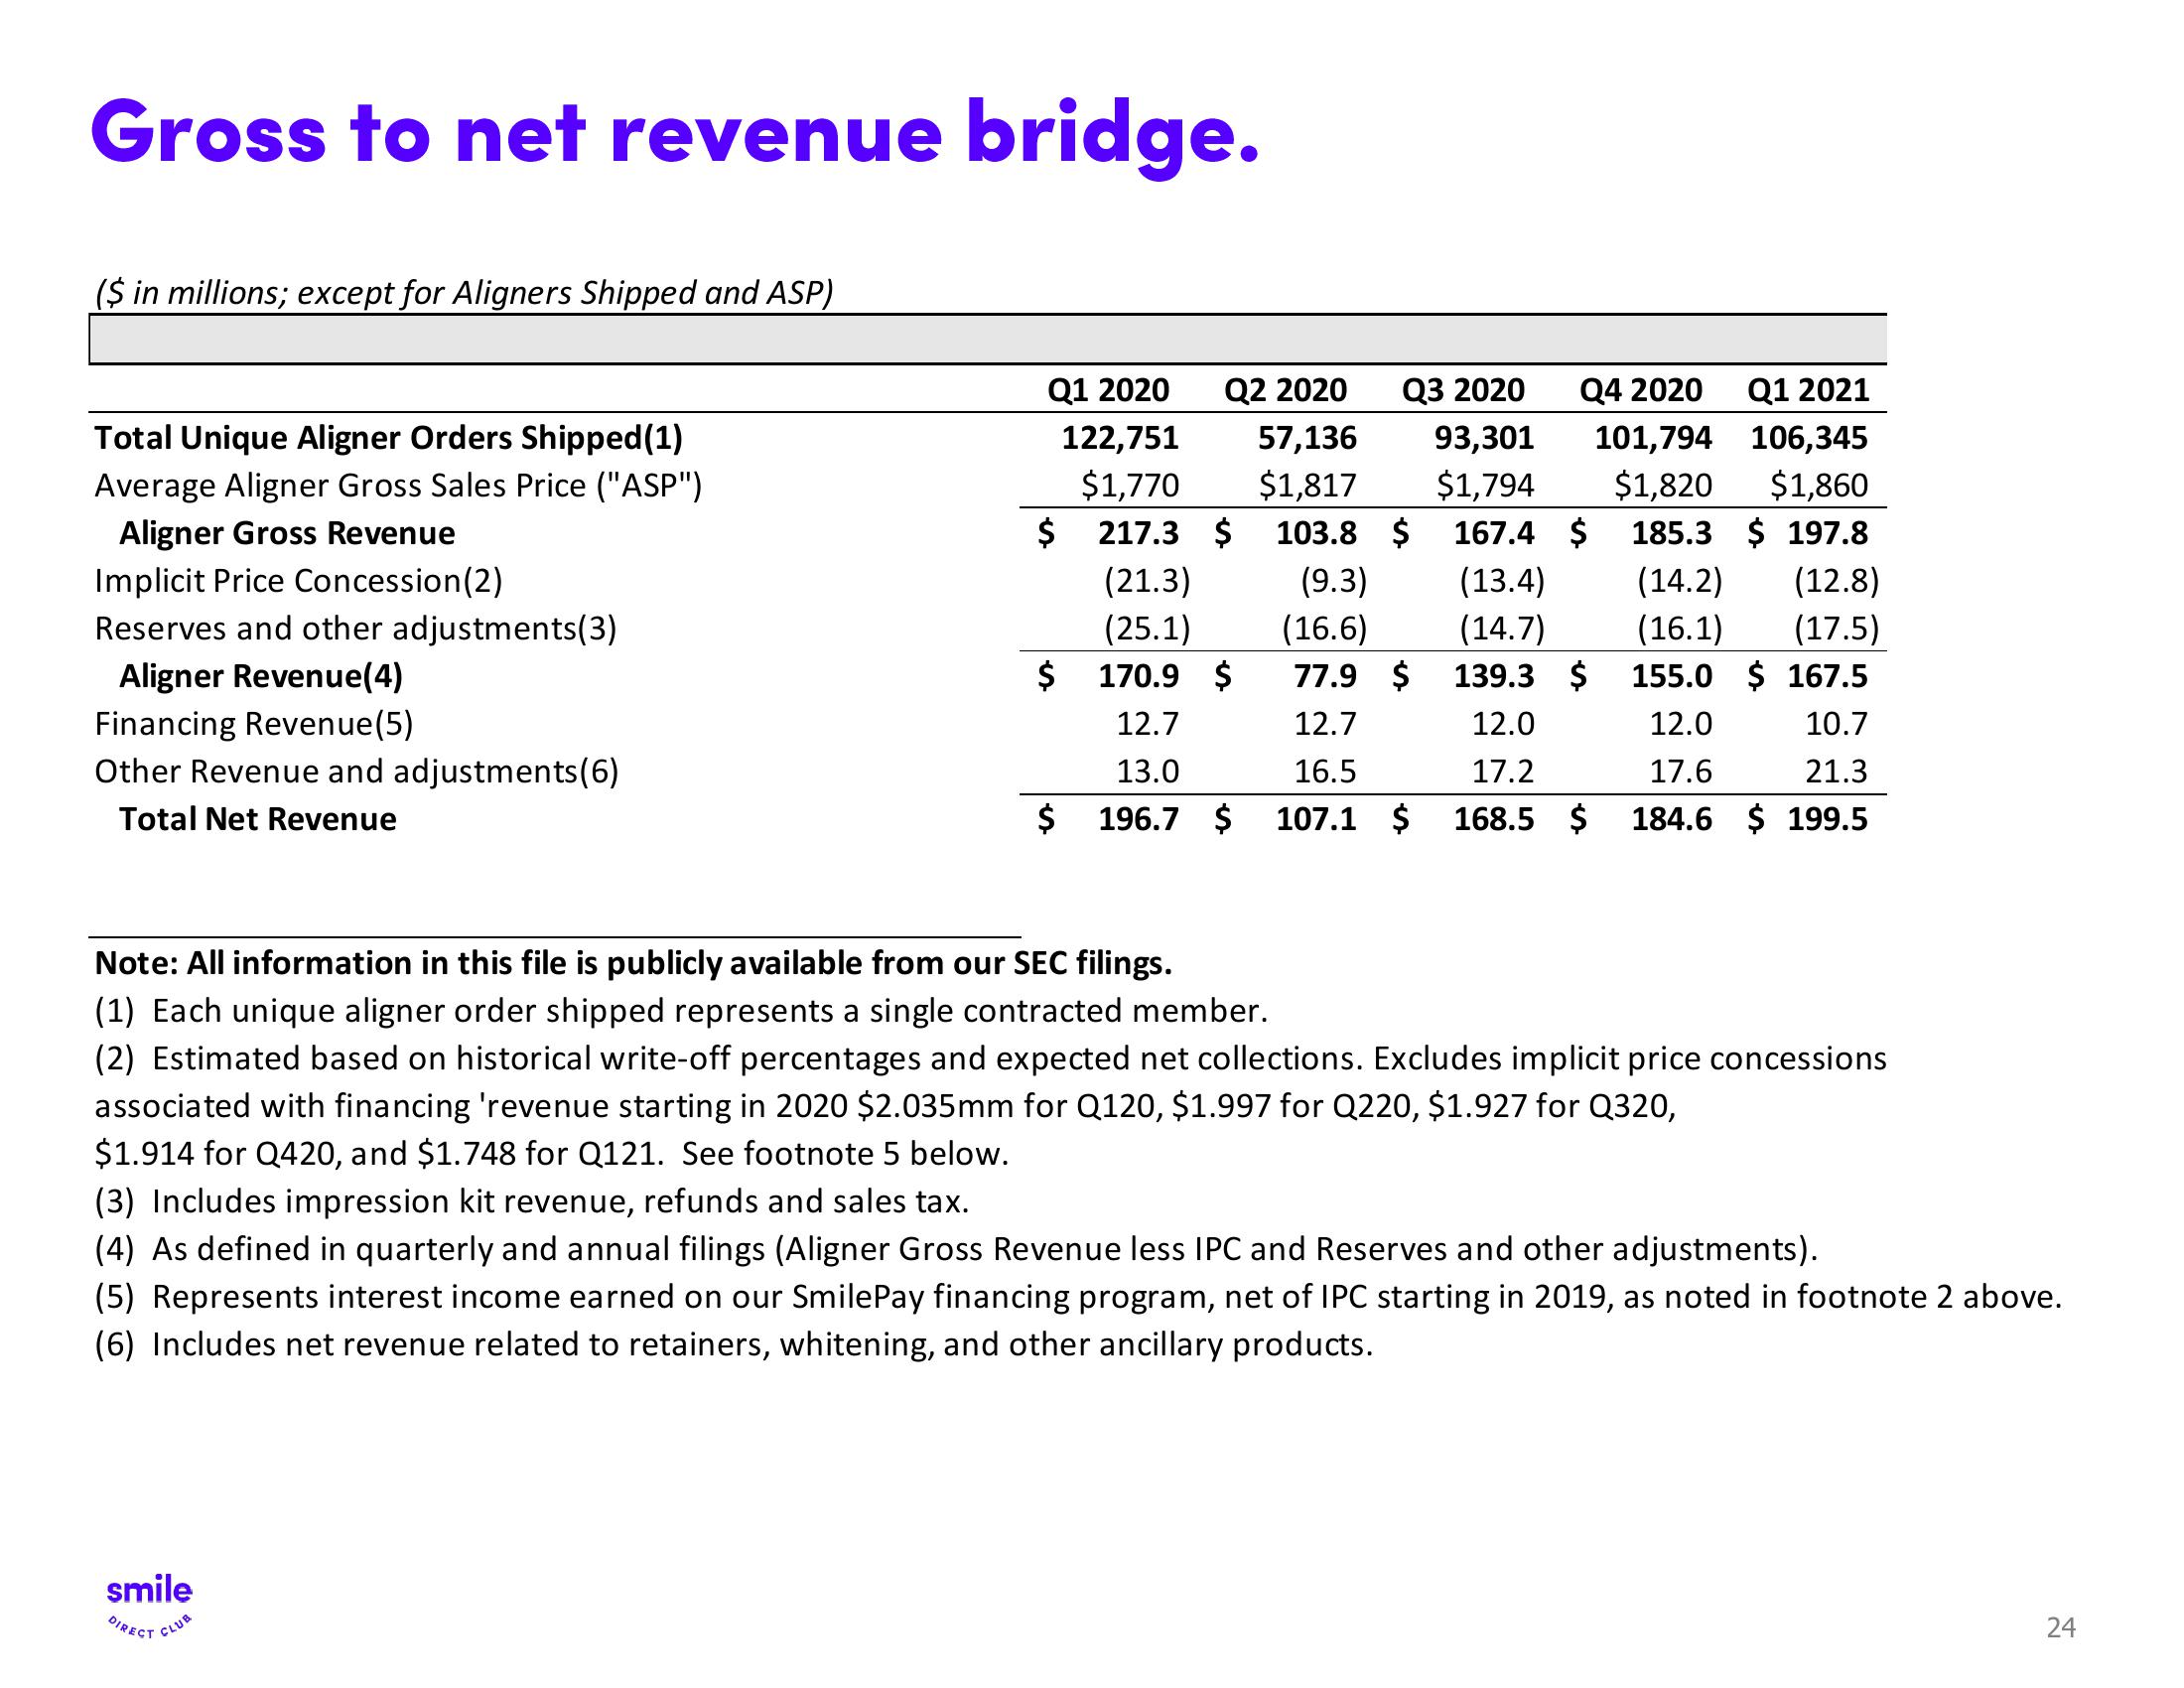
Gross to net revenue bridge.
($ in millions; except for Aligners Shipped and ASP)
Total Unique Aligner Orders Shipped (1)
Average Aligner Gross Sales Price ("ASP")
Aligner Gross Revenue
Implicit Price Concession (2)
Reserves and other adjustments(3)
Aligner Revenue(4)
Financing Revenue (5)
Other Revenue and adjustments(6)
Total Net Revenue
Q1 2020
122,751
$1,770
Q2 2020
57,136
$1,817
$ 217.3 $ 103.8 $
(21.3)
(25.1)
170.9 $
12.7
13.0
16.5
196.7 $ 107.1 $
$
smile
DIRECT CLUB
$
Q3 2020
Q4 2020
93,301
101,794
$1,794
$1,820
167.4 $ 185.3
(13.4)
(14.2)
(12.8)
(14.7)
(16.1) (17.5)
139.3 $ 155.0 $167.5
12.0
12.0
17.2
17.6
168.5 $ 184.6 $199.5
Q1 2021
106,345
$1,860
$197.8
(9.3)
(16.6)
77.9 $
12.7
10.7
21.3
Note: All information in this file is publicly available from our SEC filings.
(1) Each unique aligner order shipped represents a single contracted member.
(2) Estimated based on historical write-off percentages and expected net collections. Excludes implicit price concessions
associated with financing 'revenue starting in 2020 $2.035mm for Q120, $1.997 for Q220, $1.927 for Q320,
$1.914 for Q420, and $1.748 for Q121. See footnote 5 below.
(3) Includes impression kit revenue, refunds and sales tax.
(4) As defined in quarterly and annual filings (Aligner Gross Revenue less IPC and Reserves and other adjustments).
(5) Represents interest income earned on our SmilePay financing program, net of IPC starting in 2019, as noted in footnote 2 above.
(6) Includes net revenue related to retainers, whitening, and other ancillary products.
24View entire presentation