ZipRecruiter Investor Presentation Deck
Reconciliations of non-GAAP financial measures to the most directly comparable
GAAP measures
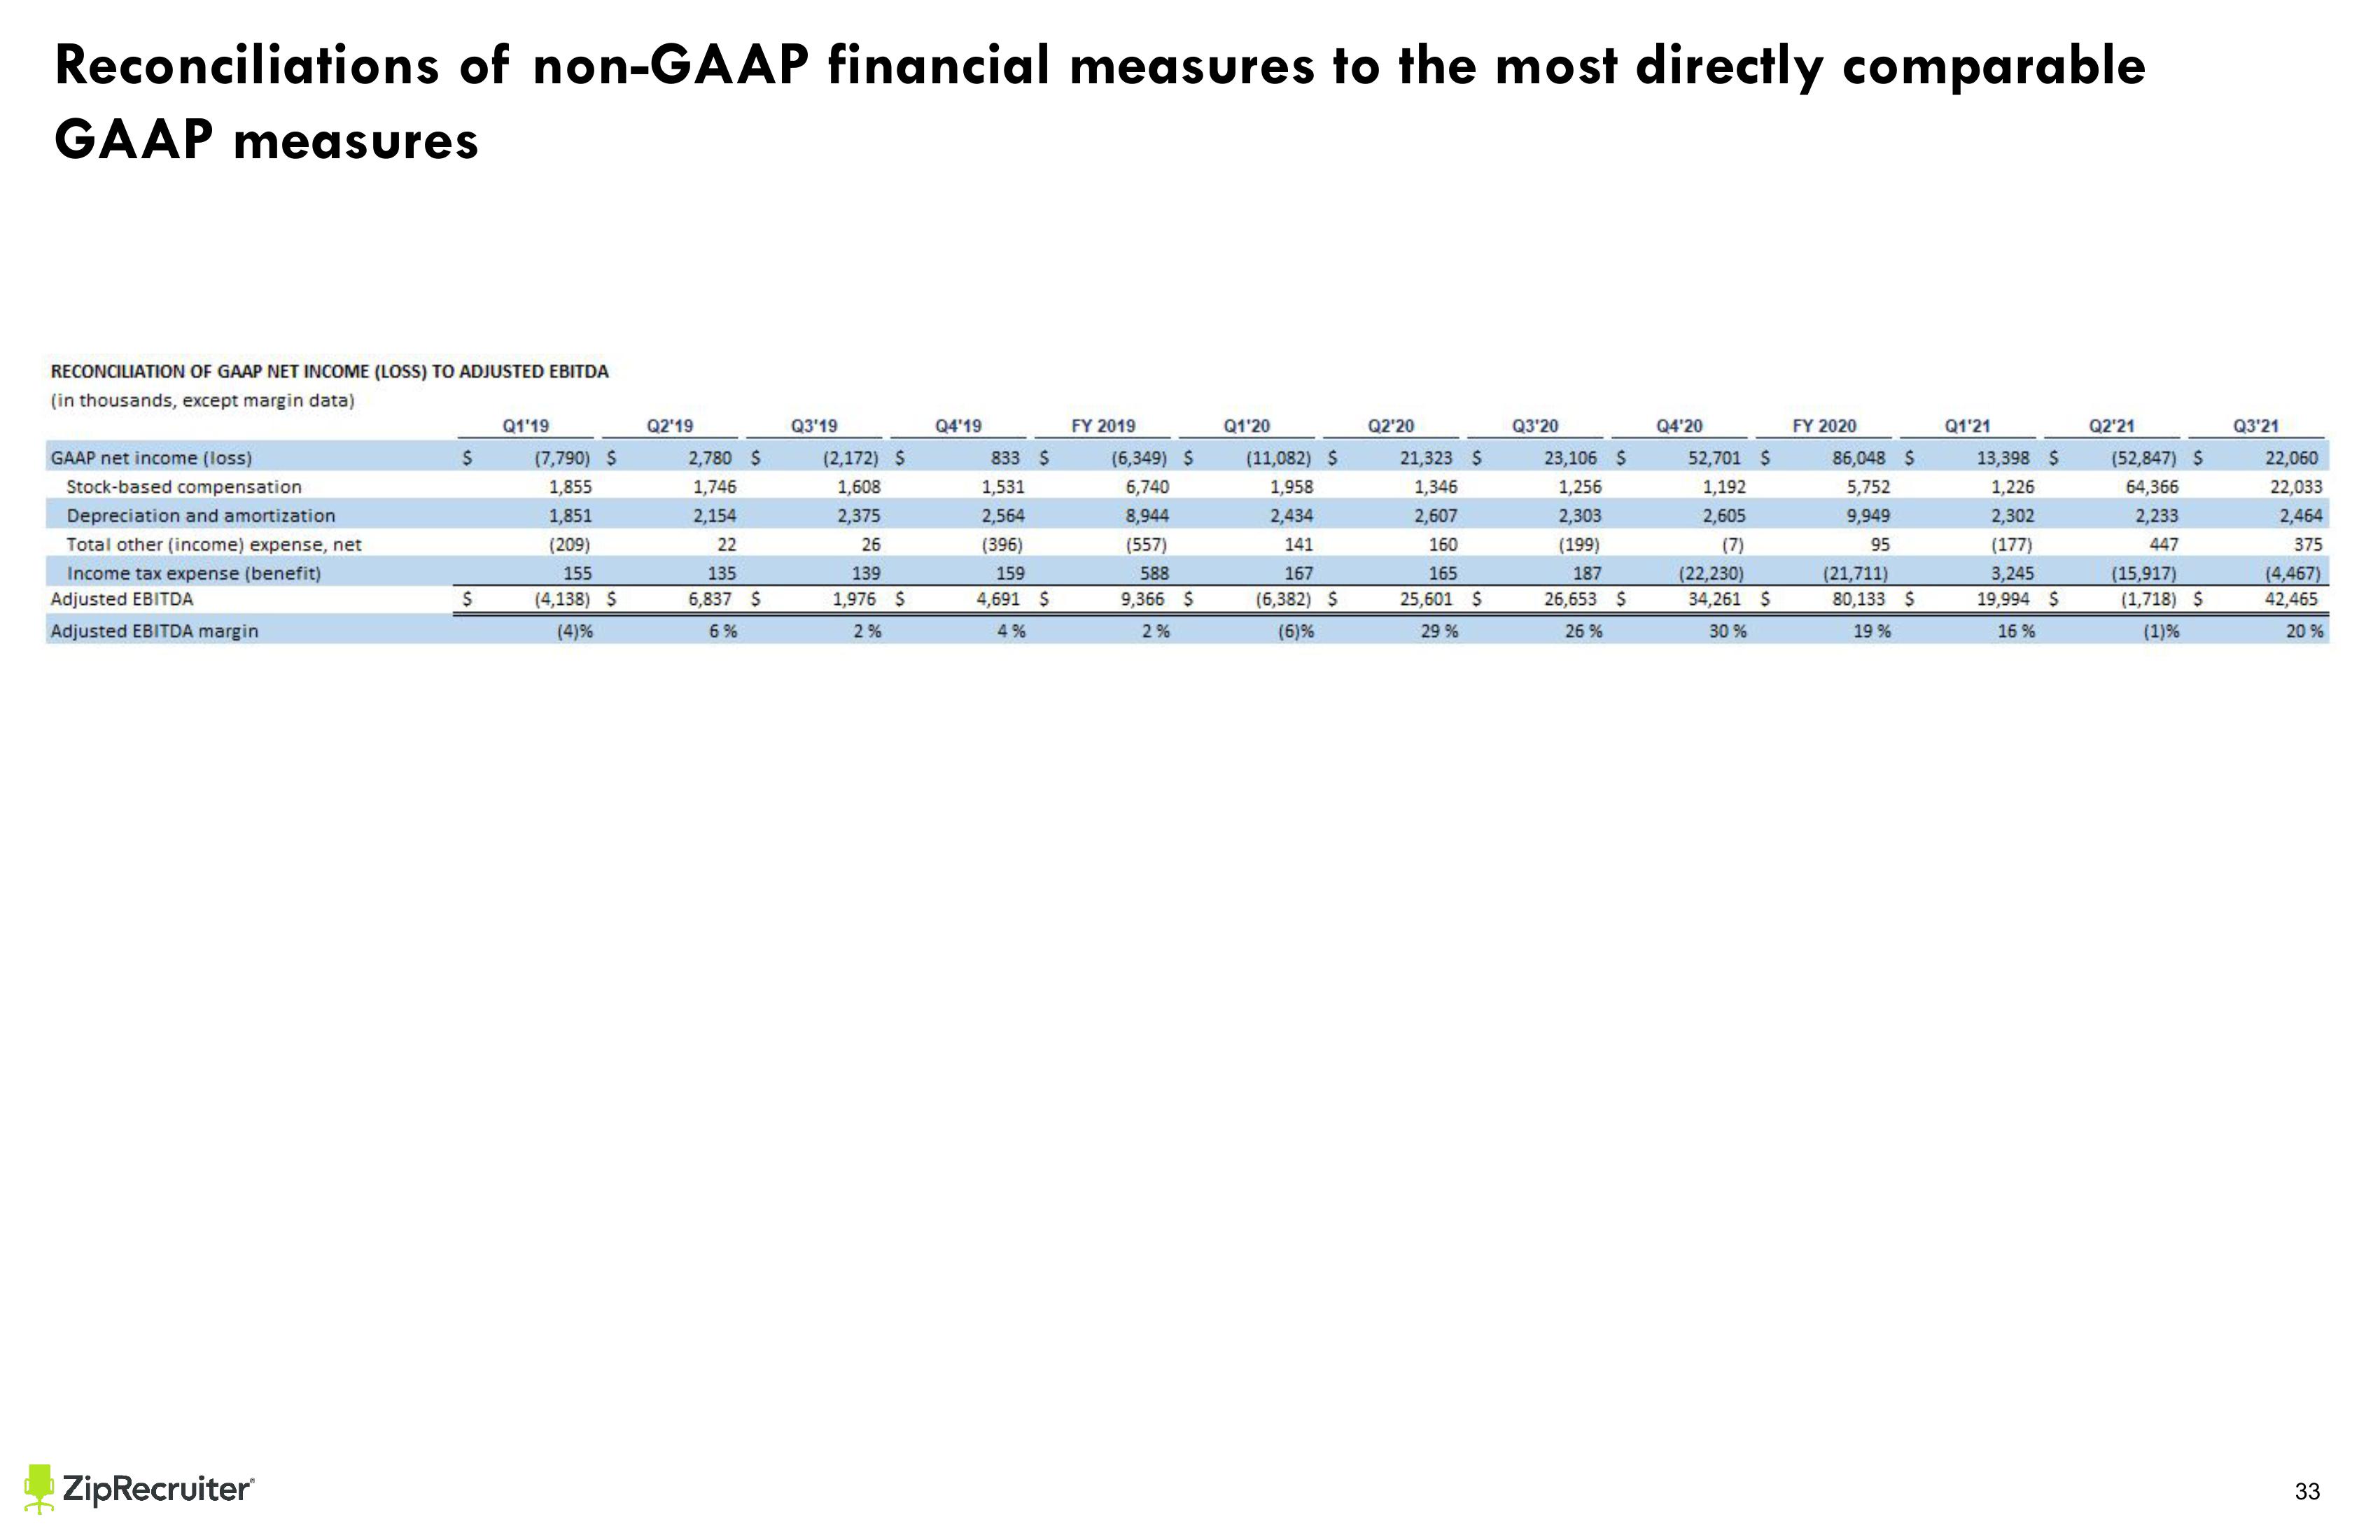
RECONCILIATION OF GAAP NET INCOME (LOSS) TO ADJUSTED EBITDA
(in thousands, except margin data)
GAAP net income (loss)
Stock-based compensation
Depreciation and amortization
Total other (income) expense, net
Income tax expense (benefit)
Adjusted EBITDA
Adjusted EBITDA margin
ZipRecruiter
$
$
Q1'19
(7,790) S
1,855
1,851
(209)
155
(4,138) S
(4)%
Q2'19
2,780 $
1,746
2,154
22
135
6,837 $
6%
Q3'19
(2,172) S
1,608
2,375
26
139
1,976 $
2%
Q4'19
833 $
1,531
2,564
(396)
159
4,691 S
4%
FY 2019
(6,349) S
6,740
8,944
(557)
588
9,366 $
2%
Q1'20
(11,082) S
1,958
2,434
141
167
(6,382) S
(6)%
Q2'20
21,323 $
1,346
2,607
160
165
25,601 $
29%
Q3'20
23,106 $
1,256
2,303
(199)
187
26,653 $
26%
Q4'20
52,701 $
1,192
2,605
(7)
(22,230)
34,261 S
30%
FY 2020
86,048 $
5,752
9,949
95
(21,711)
80,133 $
19%
Q1'21
13,398 $
1,226
2,302
(177)
3,245
19,994 $
16%
Q2'21
(52,847) S
64,366
2,233
447
(15,917)
(1,718) S
(1)%
Q3'21
22,060
22,033
2,464
375
(4,467)
42,465
20%
33View entire presentation