Snap Inc Results Presentation Deck
Second Quarter Financial Summary
Revenue
Operating
Performance
●
Cash
●
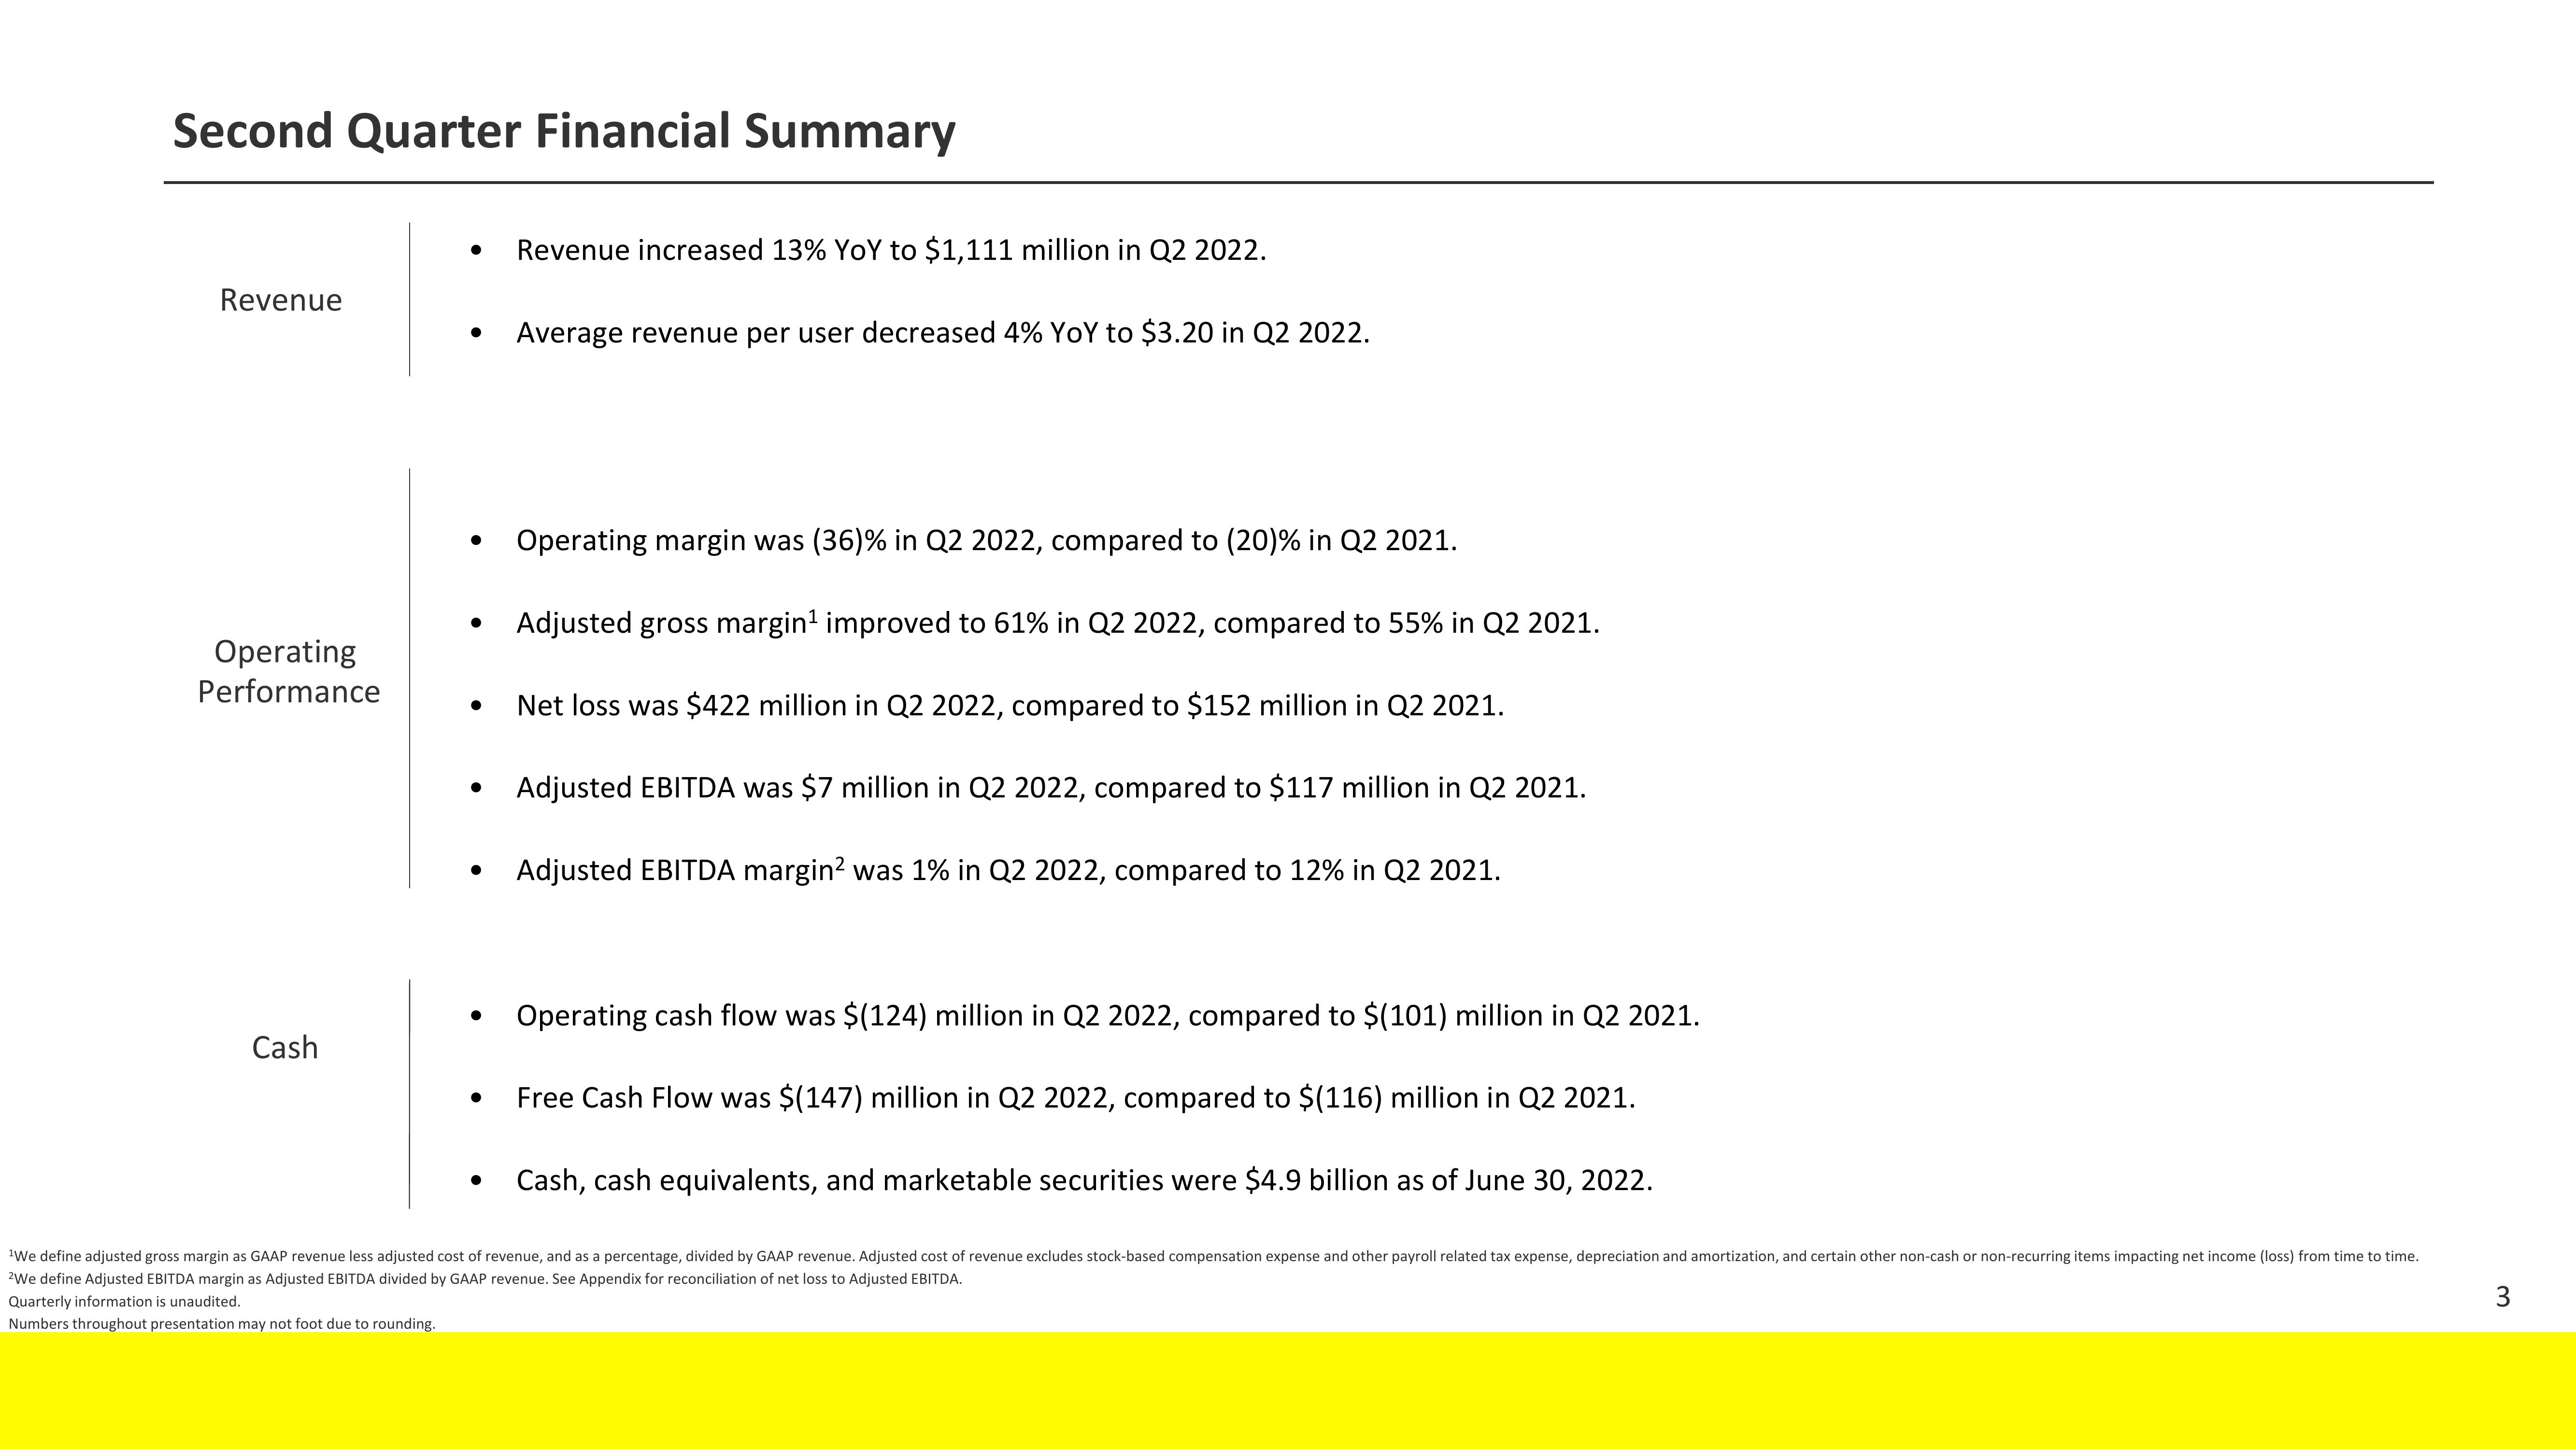
Revenue increased 13% YoY to $1,111 million in Q2 2022.
Average revenue per user decreased 4% YoY to $3.20 in Q2 2022.
Operating margin was (36) % in Q2 2022, compared to (20) % in Q2 2021.
Adjusted gross margin¹ improved to 61% in Q2 2022, compared to 55% in Q2 2021.
Net loss was $422 million in Q2 2022, compared to $152 million in Q2 2021.
Adjusted EBITDA was $7 million in Q2 2022, compared to $117 million in Q2 2021.
Adjusted EBITDA margin² was 1% in Q2 2022, compared to 12% in Q2 2021.
Operating cash flow was $(124) million in Q2 2022, compared to $(101) million in Q2 2021.
Free Cash Flow was $(147) million in Q2 2022, compared to $(116) million in Q2 2021.
• Cash, cash equivalents, and marketable securities were $4.9 billion as of June 30, 2022.
¹We define adjusted gross margin as GAAP revenue less adjusted cost of revenue, and as a percentage, divided by GAAP revenue. Adjusted cost of revenue excludes stock-based compensation expense and other payroll related tax expense, depreciation and amortization, and certain other non-cash or non-recurring items impacting net income (loss) from time to time.
2We define Adjusted EBITDA margin as Adjusted EBITDA divided by GAAP revenue. See Appendix for reconciliation of net loss to Adjusted EBITDA.
Quarterly information is unaudited.
Numbers throughout presentation may not foot due to rounding.
3View entire presentation