Investor Presentation
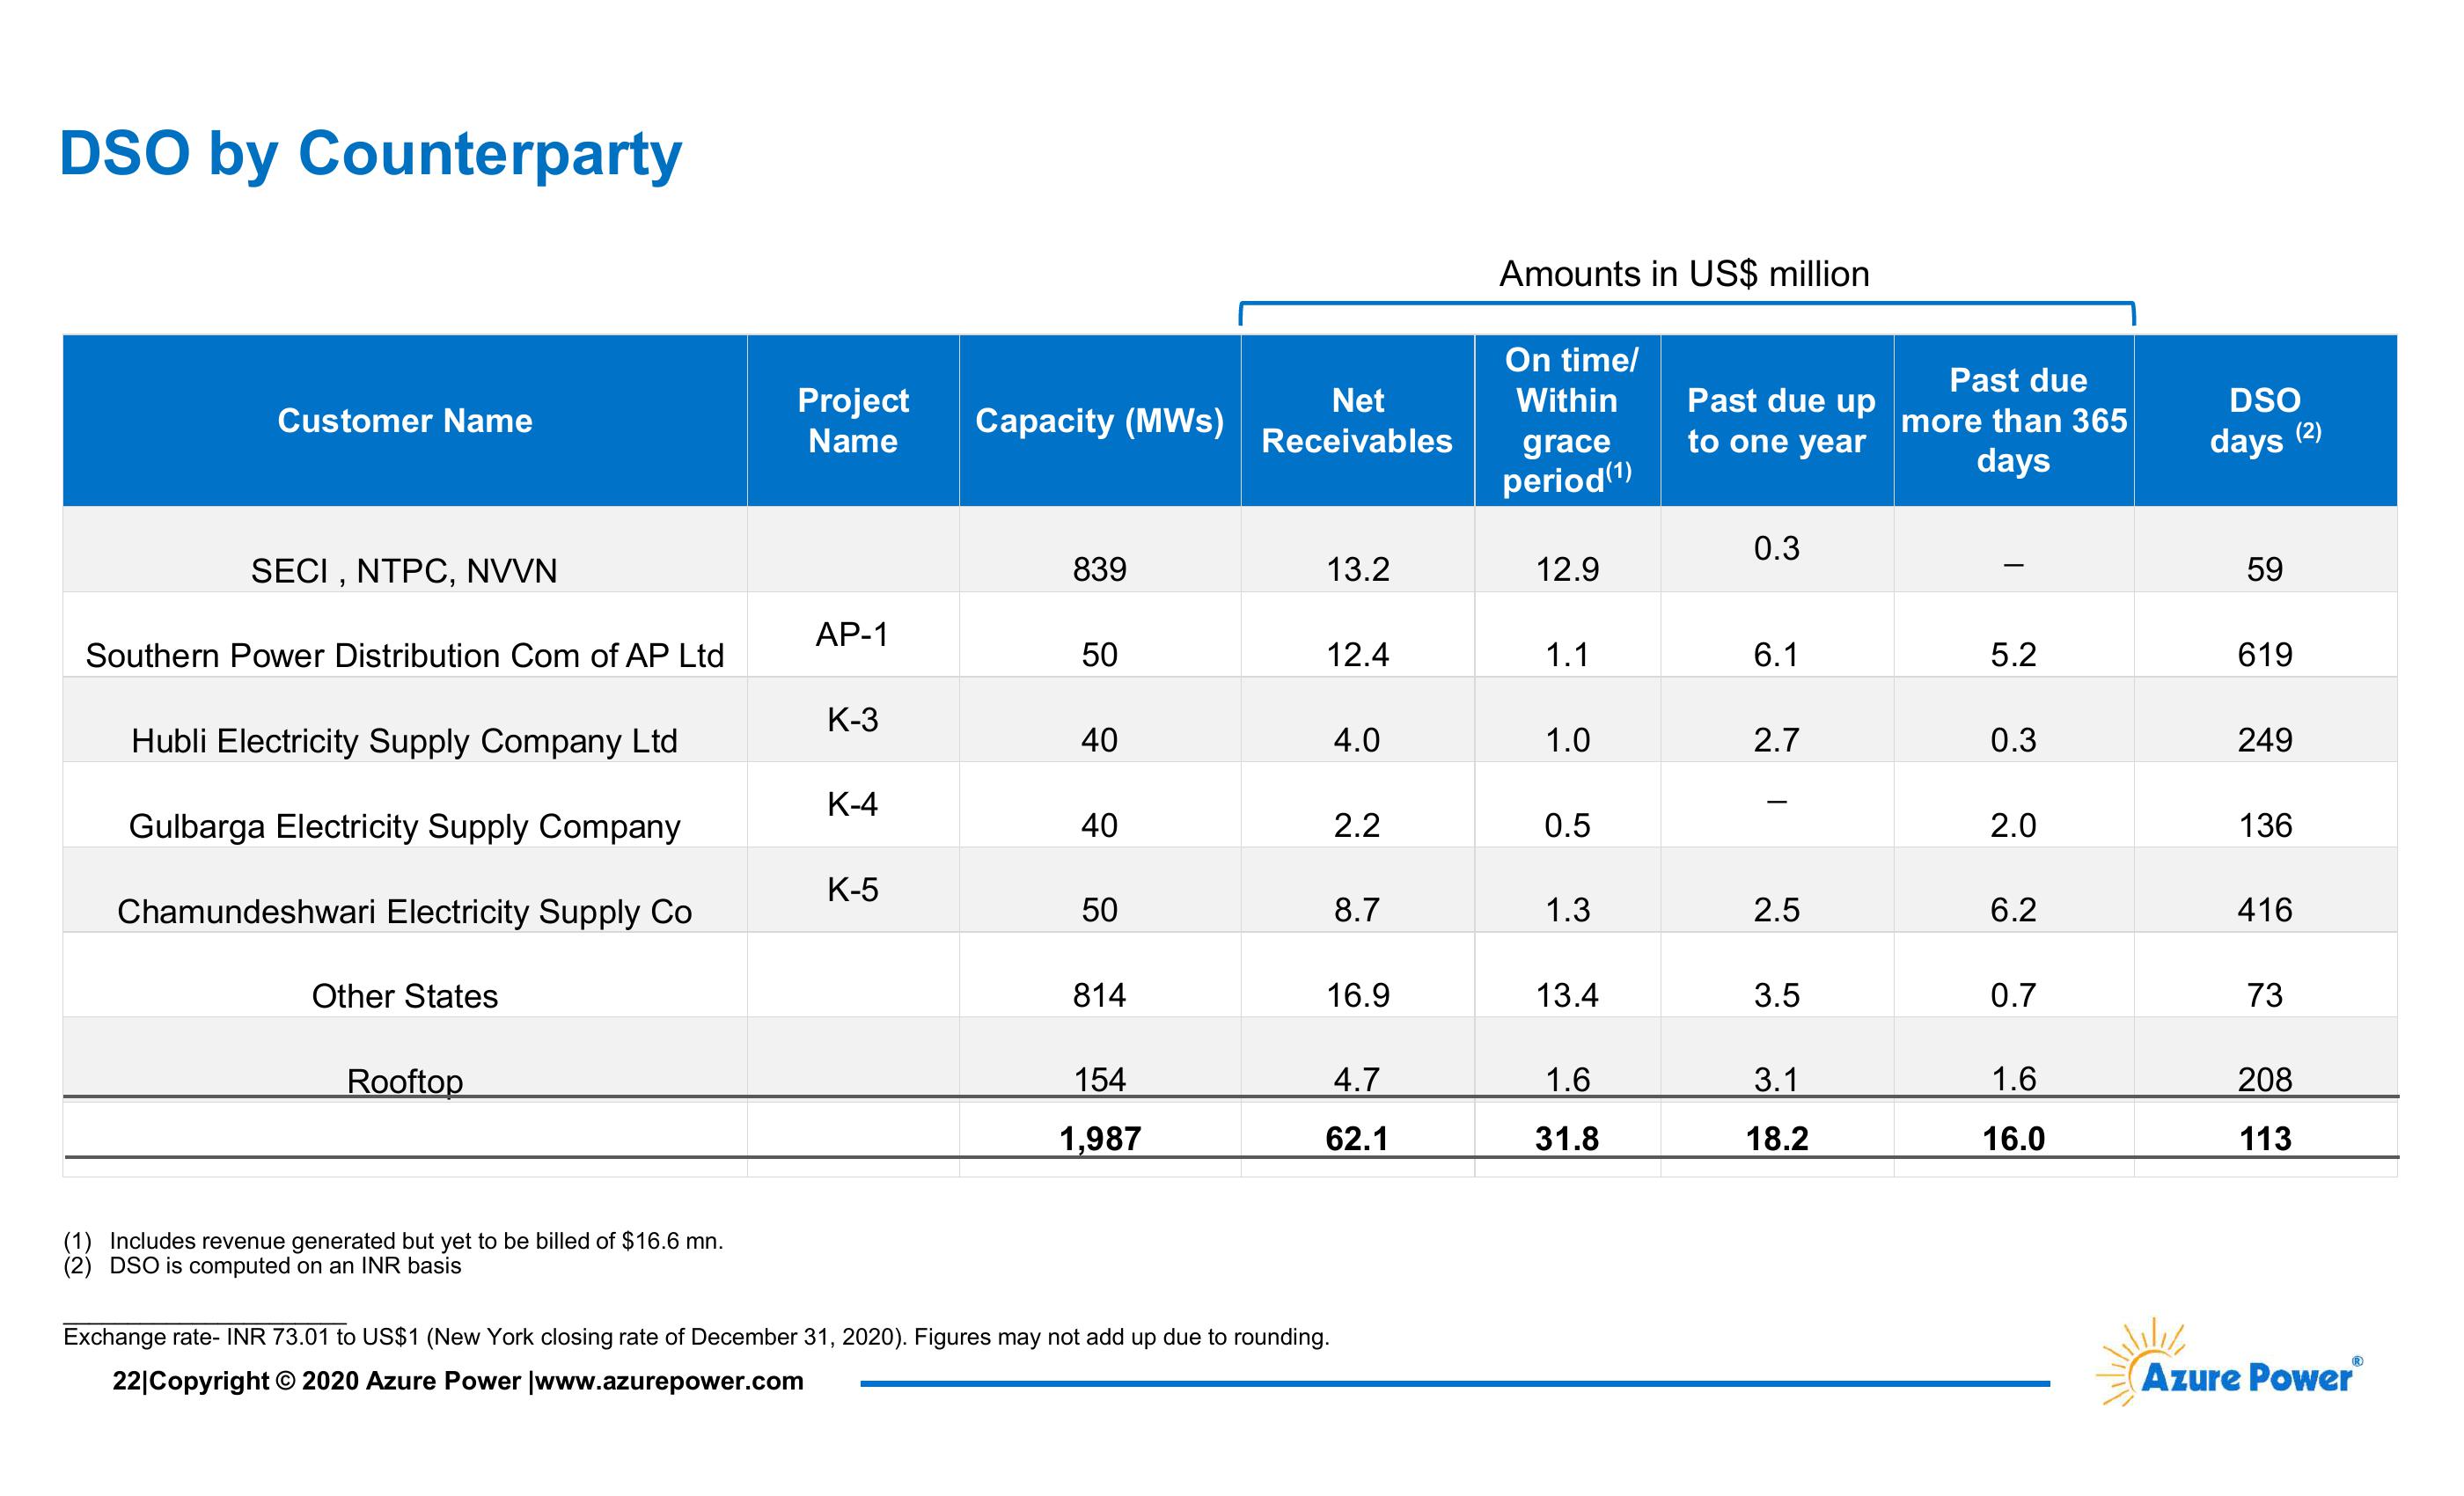
DSO by Counterparty
Amounts in US$ million
On time/
Customer Name
Project
Name
Capacity (MWs)
Net
Receivables
Within
grace
Past due up
to one year
Past due
more than 365
DSO
days (2)
period (1)
days
0.3
SECI, NTPC, NVVN
839
AP-1
Southern Power Distribution Com of AP Ltd
580
13.2
12.9
59
12.4
1.1
6.1
5.2
619
K-3
Hubli Electricity Supply Company Ltd
40
4.0
1.0
2.7
0.3
249
K-4
Gulbarga Electricity Supply Company
40
2.2
0.5
2.0
136
K-5
Chamundeshwari Electricity Supply Co.
50
8.7
1.3
2.5
6.2
416
Other States
814
16.9
13.4
3.5
0.7
73
Rooftop
154
4.7
1.6
3.1
1.6
208
1,987
62.1
31.8
18.2
16.0
113
(1) Includes revenue generated but yet to be billed of $16.6 mn.
(2) DSO is computed on an INR basis
Exchange rate- INR 73.01 to US$1 (New York closing rate of December 31, 2020). Figures may not add up due to rounding.
22|Copyright © 2020 Azure Power |www.azurepower.com
®
Azure PowerⓇView entire presentation