Overstock Results Presentation Deck
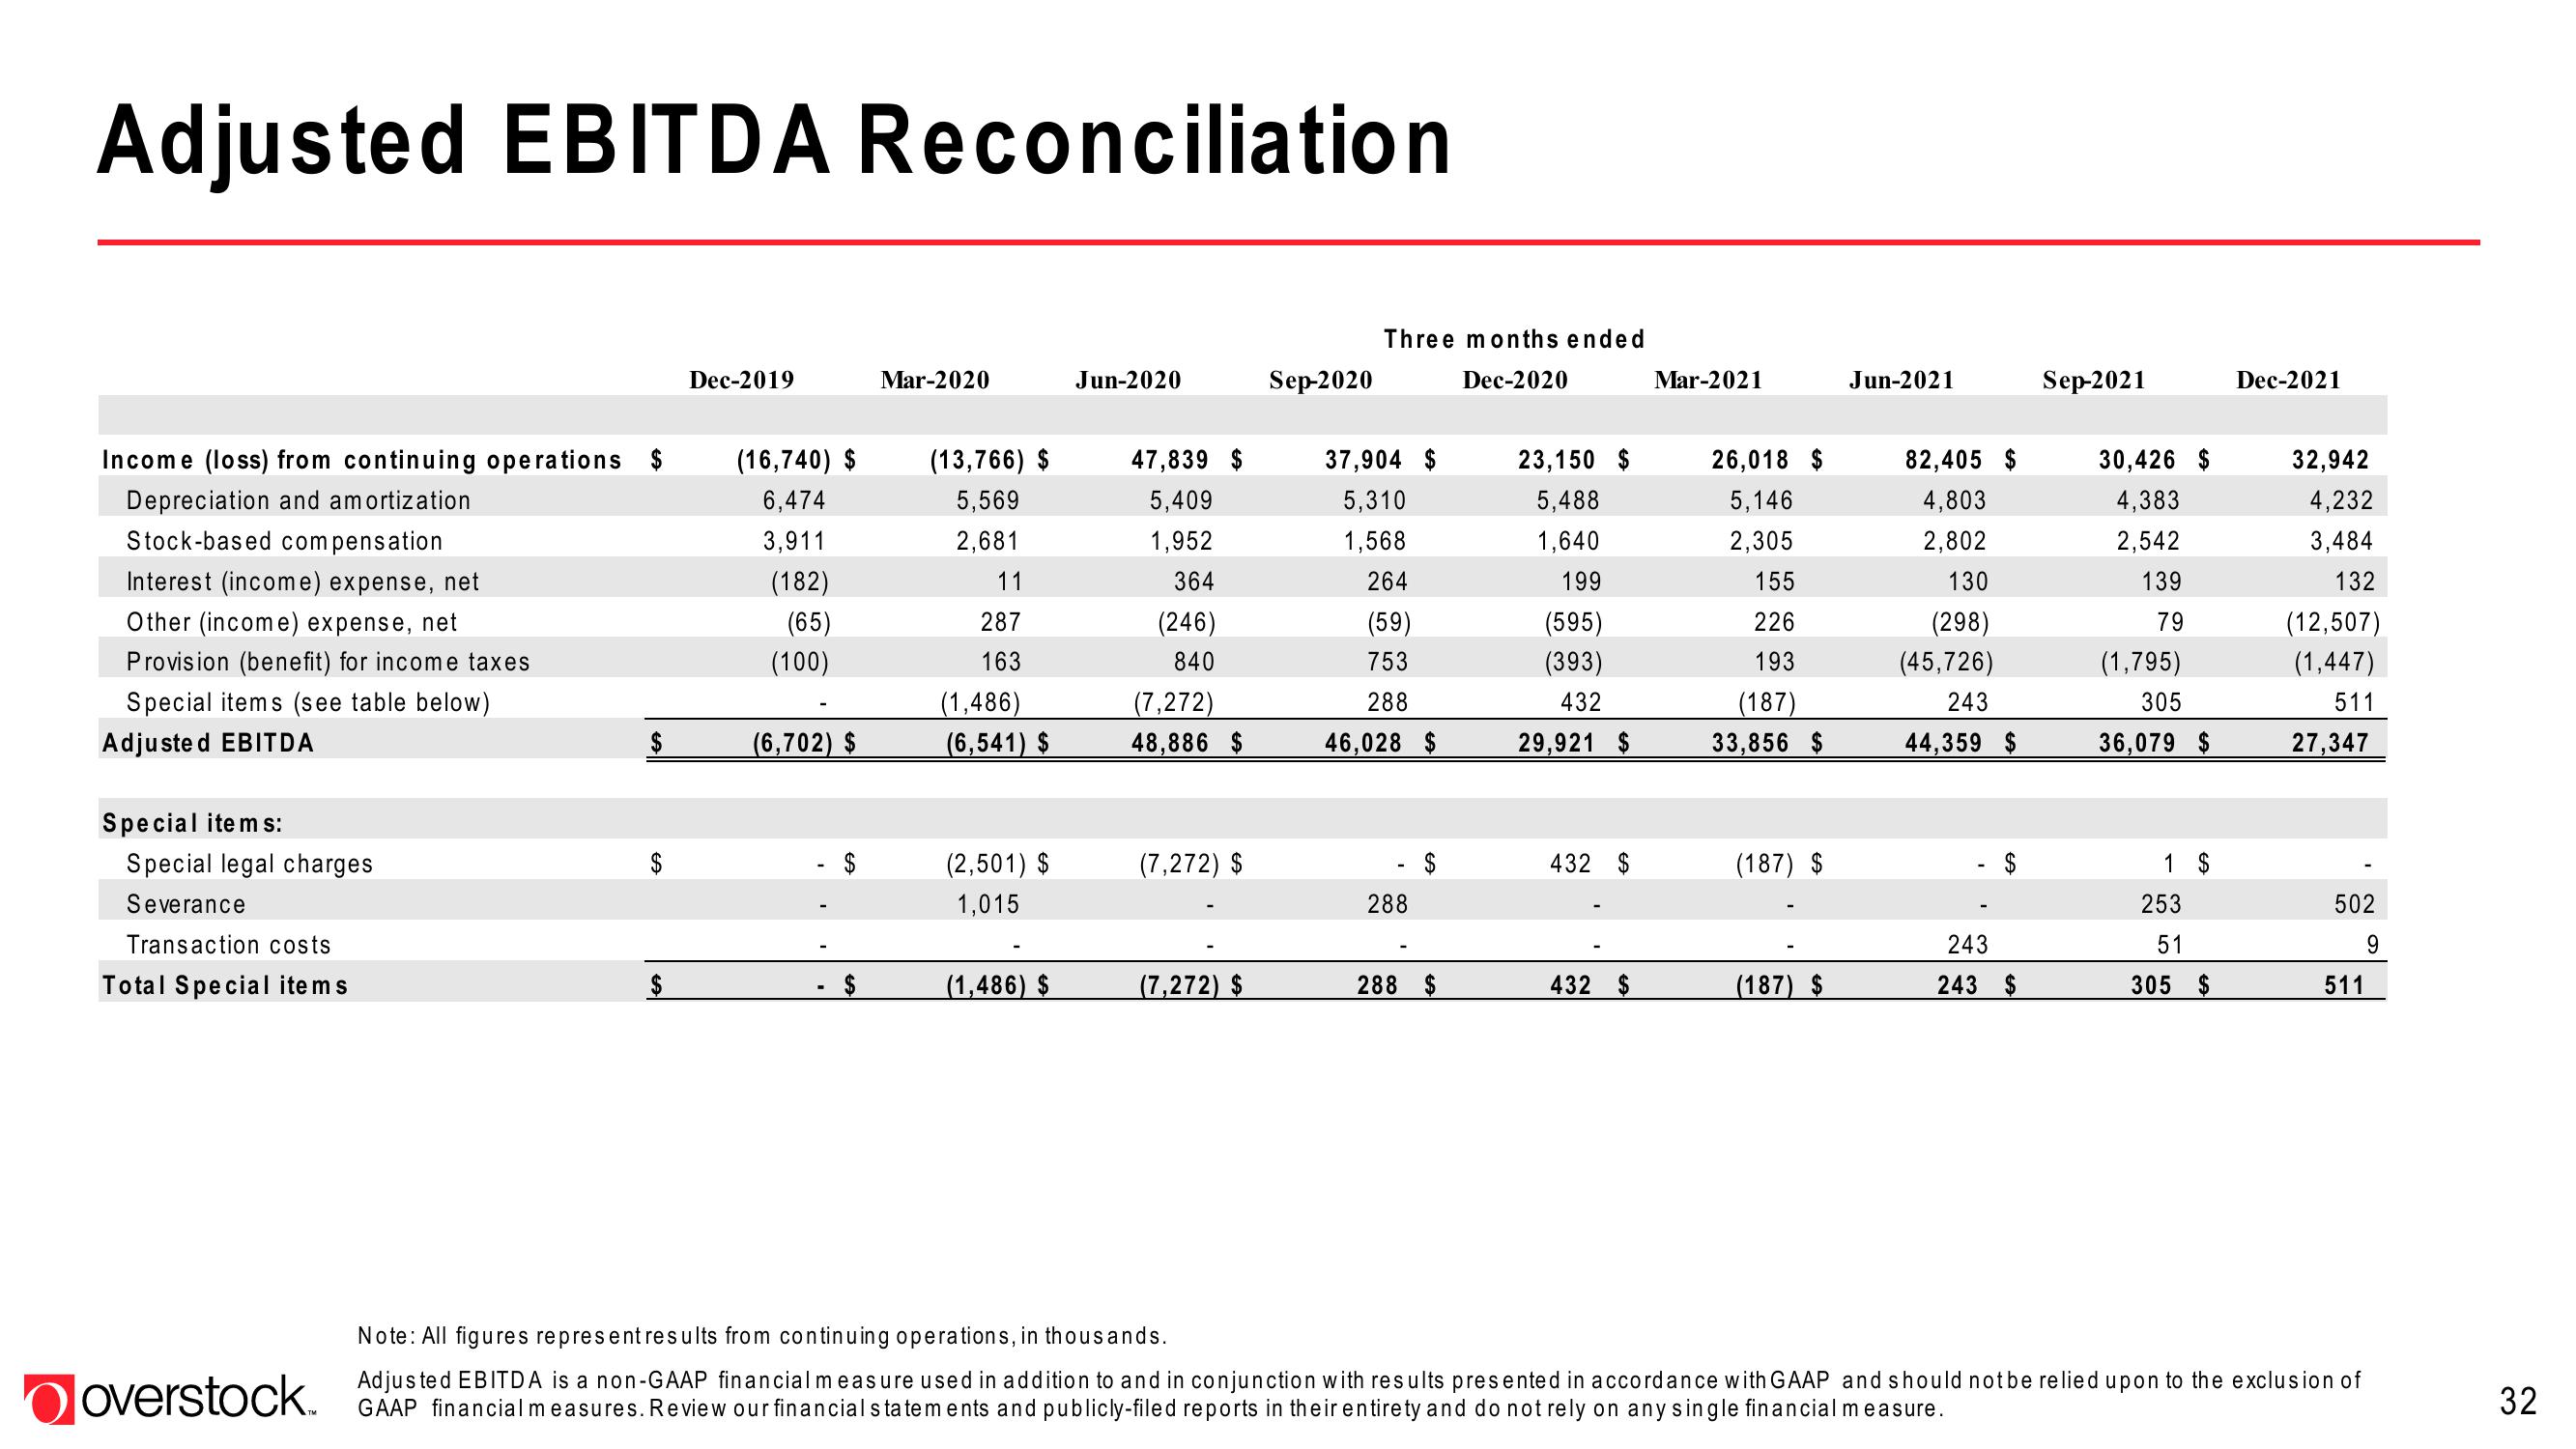
Adjusted EBITDA Reconciliation
Income (loss) from continuing operations $
Depreciation and amortization
Stock-based compensation
Interest (income) expense, net
Other (income) expense, net
Provision (benefit) for income taxes
Special items (see table below)
Adjusted EBITDA
Special items:
Special legal charges
Severance
Transaction costs
Total Special items
$
$
Dec-2019
(16,740) $
6,474
3,911
(182)
(65)
(100)
(6,702) $
Mar-2020
(13,766) $
5,569
2,681
11
287
163
(1,486)
(6,541) $
(2,501) $
1,015
(1,486) $
Jun-2020
47,839 $
5,409
1,952
364
(246)
840
(7,272)
48,886 $
(7,272) $
(7,272) $
Sep-2020
Three months ended
Dec-2020
37,904 $
5,310
1,568
264
(59)
753
288
46,028 $
288
288 $
23,150 $
5,488
1,640
199
(595)
(393)
432
29,921 $
432 $
432 $
Mar-2021
26,018 $
5,146
2,305
155
226
193
(187)
33,856 $
(187) $
(187) $
Jun-2021
82,405 $
4,803
2,802
130
(298)
(45,726)
243
44,359 $
243
243 $
Sep-2021
30,426 $
4,383
2,542
139
79
(1,795)
305
36,079 $
1 $
253
51
305 $
Dec-2021
32,942
4,232
3,484
132
(12,507)
(1,447)
511
27,347
502
9
511
Note: All figures represent results from continuing operations, in thousands.
GAAP entirety do rely on any single financial measure.
overstock. At financial measures. Review our financial statements and publicly-filed repous in the with first to presented in accordance with GAAP and should not be relied upon to the exclusion of
32View entire presentation