Fort Capital Investment Banking Pitch Book
Appendix B: Detailed Financial Model
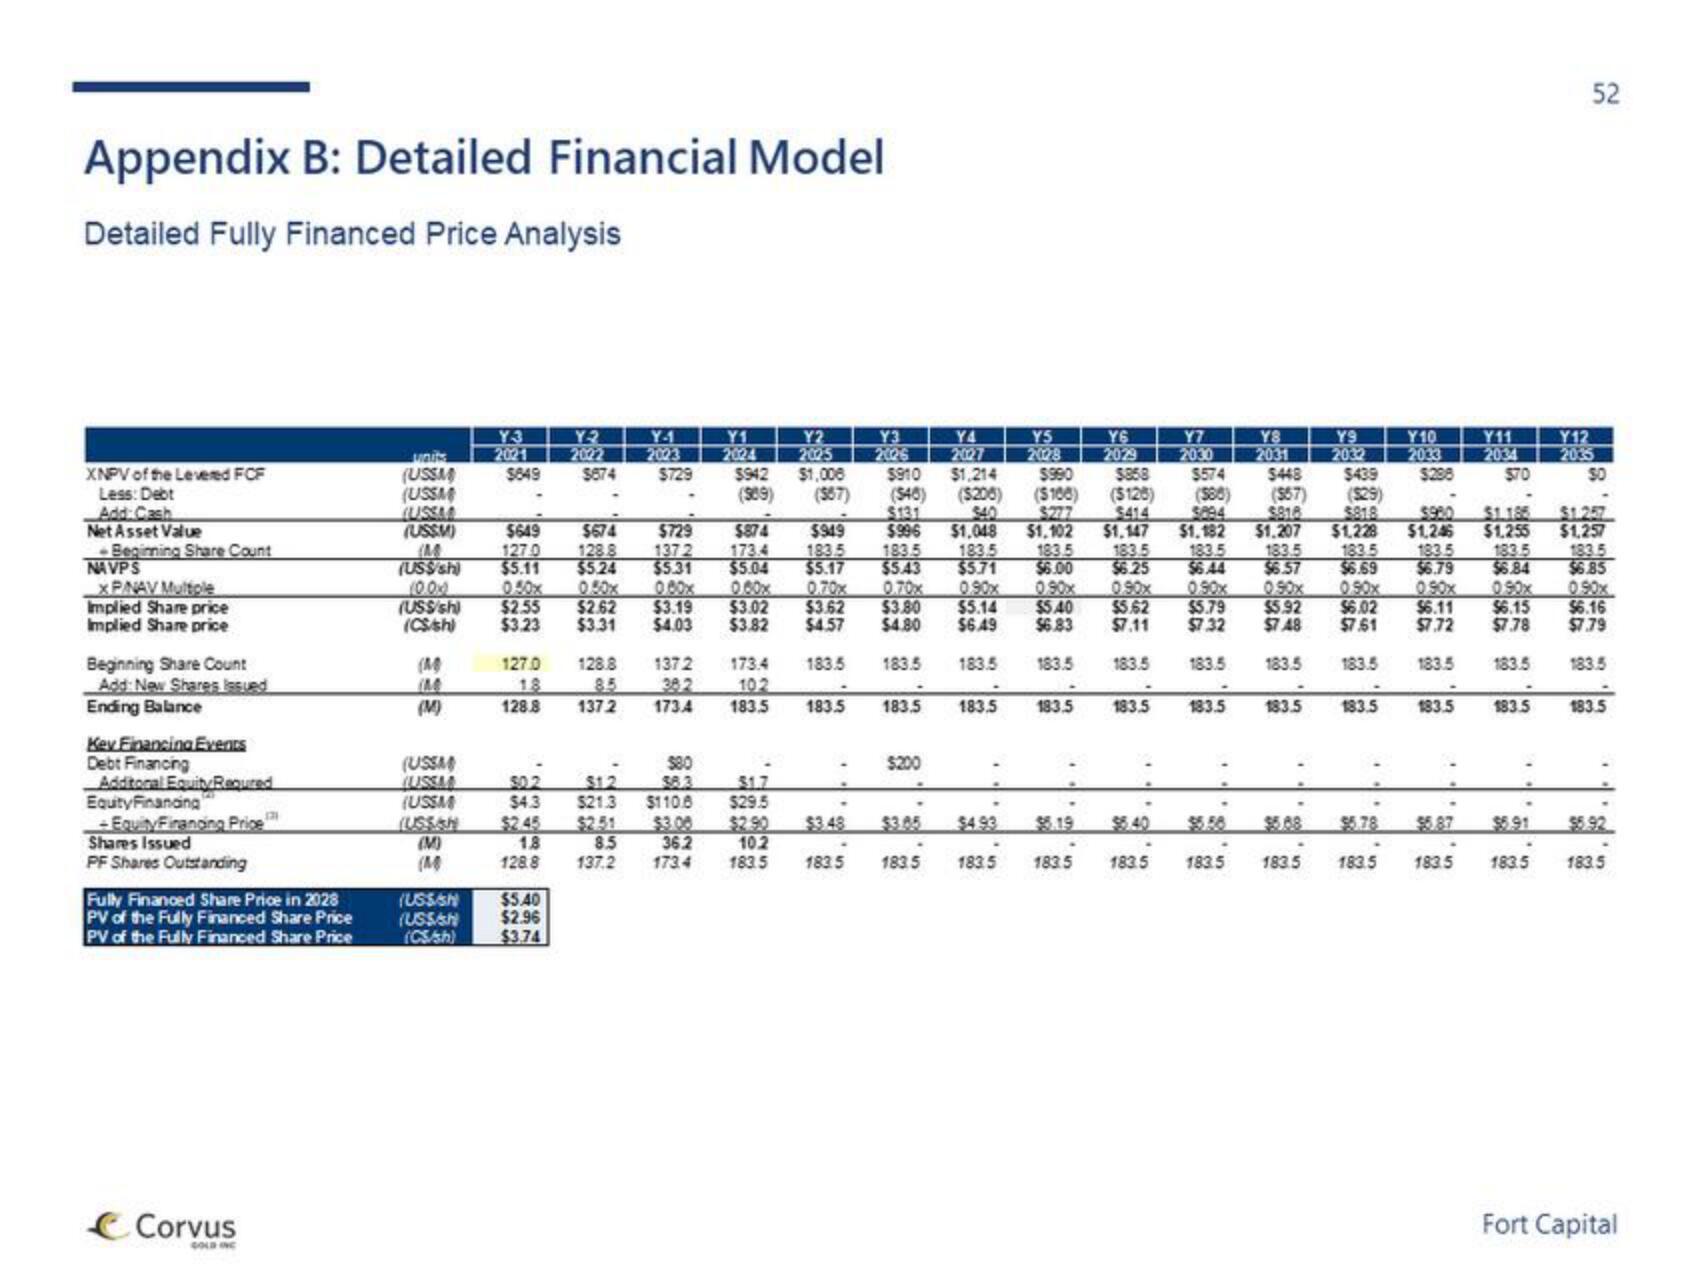
Detailed Fully Financed Price Analysis
XNPV of the Levered FCF
Less: Debt
Add Cash
Net Asset Value
Beginning Share Count
NAVPS
XP/NAV Multiple
Implied Share price
Implied Share price
Beginning Share Count
Add: New Shares issued
Ending Balance
Key Financing Events
Debt Financing
Additoral EquityRequired
Equity Financing
-EquityFiranding Price
Shares Issued
PF Shares Outstanding
Fully Financed Share Price in 2028
PV of the Fully Financed Share Price
PV of the Fully Financed Share Price
Corvus
units
(USSM)
(USSM
(USSMA
(USSM)
(US$/sh)
10.00
(US$/sh)
(CS/sh)
(M
(M)
(USSM)
(USSM
(USSM
(M)
(USSISH
(USSAN
(CS/sh)
Y3
2021
Y6
2029
$910 $1,214
$990
($40) ($206) ($100)
$131
Y9
2032
$858 $574 $448 $439
($126)
(586) ($57) ($29)
$277 $414 $894 $818 5818 $980 $1.185
$1,048
$1,102 $1,147 $1.182 $1.207 $1,228 $1,246 $1,255
183.5 183.5 183.5 183.5 183.5 183.5 183.5 183.5
$5.11 $5.24 $5.31 $5.04 $5.17 $5.43 $5.71 $6.00 $6.25 $6.44 $6.57 $6.69 $6.79 $6.84
0.50x
0.00x 0.00x 0.70x 0.70x 0.90x 0.90x
0.90x
0.90x
$2.55 $2.62 $3.19 $3.02 $3.62 $3.80 $5.14 $5.40 $5.62 $5.79 $5.92 $6.02
$3.23 $3.31 $4.03 $3.82 $4.57 $4.80 $6.49 $6.83 $7.11 $7.32 $7 48
$649
$674
$729
$874
173.4
$949
183.5
$996
183.5
127.0 128.8 1372
$6.15
$6.11
$7.61 $7.72 $7.78
183.5
183.5
183.5
183.5 183.5
$649
Y-2
2022
$874
127.0 128.8
85
128.8 137.2
$5.40
$2.96
$3.74
Y-1
2023
$729
$80
$4.3 $21.3 $110.8
$2.45
1.8
128.8
Y1
2024
1372 173.4
382
102
173.4 183.5
Y2
2025
$942
$1,008
(989) (567)
1734
$1.7
$29.5
Y3
2026
183.5
183.5 183.5
183.5
$2.51 $3.00 $2.90 $3.48 $3.05
8.5
36.2
10.2
183.5
137.2
183.5
$200
Y4
2027
Y5
2028
183.5
183.5
183.5 183.5 183.5
$4.93 $5.19
1835
183.5 183.5
Y7
2030
183.5
183.5
Y8
2031
183.5
183.5
183.5
183.5
183.5
$5.78
183.5
Y10
2033
$298
Y11
2034
183.5
$70
183.5
$5.87 $5.91
183.5
183.5
52
Y12
2035
$1.257
$1,257
183.5
$6.85
0.90x
$6.16
$7.79
183.5
183.5
183.5
Fort CapitalView entire presentation