BigCommerce Results Presentation Deck
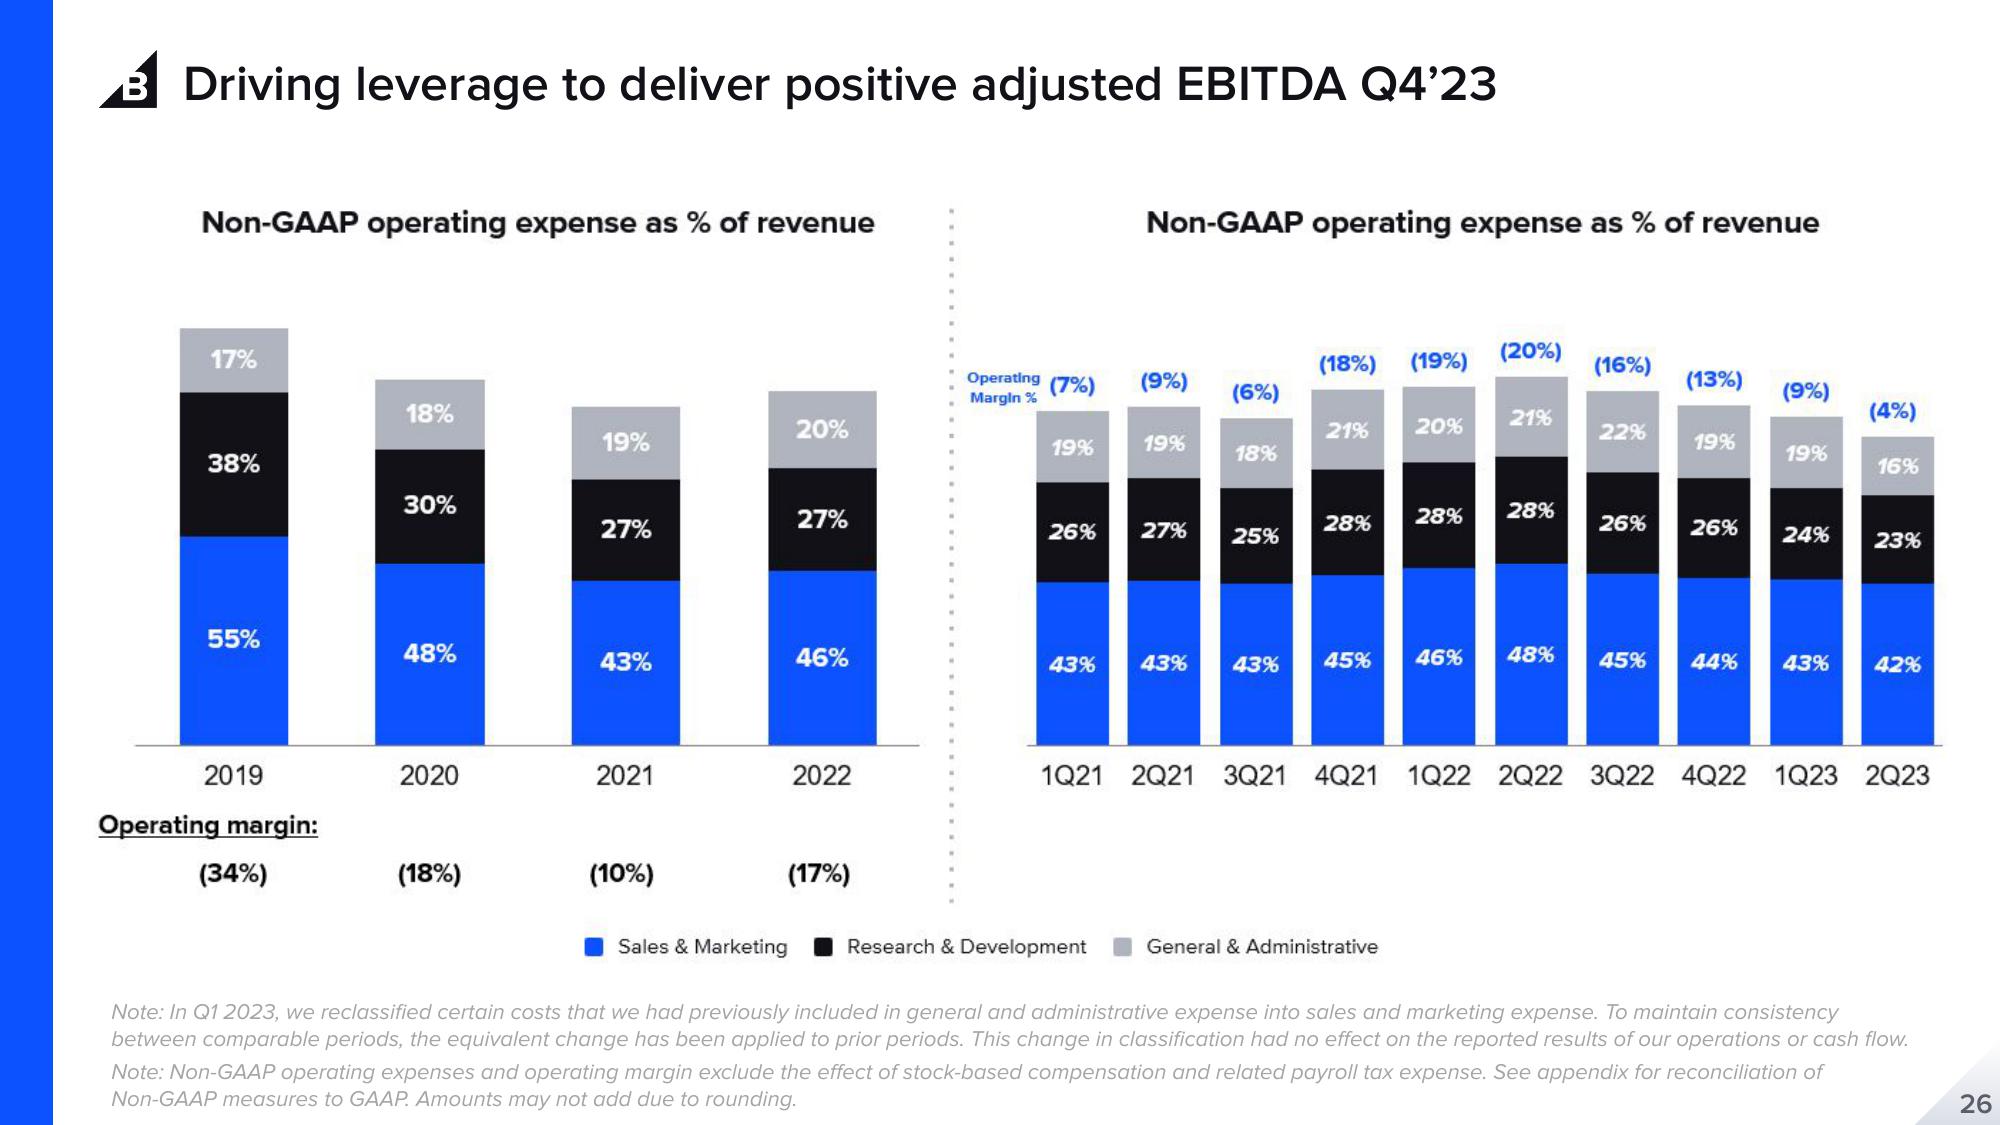
Driving leverage to deliver positive adjusted EBITDA Q4'23
Non-GAAP operating expense as % of revenue
17%
38%
55%
2019
Operating margin:
(34%)
18%
30%
48%
2020
(18%)
19%
27%
43%
2021
(10%)
20%
Sales & Marketing
27%
46%
2022
(17%)
Operating (7%)
Margin %
19%
26%
1Q21
Non-GAAP operating expense as % of revenue
Research & Development
(9%)
19%
43% 43%
27%
(6%)
18%
25%
(18%) (19%)
21% 20%
28%
43% 45%
28%
General & Administrative
46%
(20%)
21%
28%
48%
(16%)
22%
26%
(13%)
19%
26%
(9%)
19%
24%
(4%)
16%
23%
45% 44% 43% 42%
2Q21 3Q21 4Q21 1Q22 2Q22 3Q22 4Q22 1Q23 2Q23
Note: In Q1 2023, we reclassified certain costs that we had previously included in general and administrative expense into sales and marketing expense. To maintain consistency
between comparable periods, the equivalent change has been applied to prior periods. This change in classification had no effect on the reported results of our operations or cash flow.
Note: Non-GAAP operating expenses and operating margin exclude the effect of stock-based compensation and related payroll tax expense. See appendix for reconciliation of
Non-GAAP measures to GAAP. Amounts may not add due to rounding.
26View entire presentation